Rigorous technical methodologies for geospatial data analysis
All the components mentioned below are being integrated into the Commons Connect and Know Your Landscape platforms for communities and practitioners to understand the socio-ecological situation of their landscape, plan for the creation and repair of various natural resource management assets, and share these demands with relevant government programmes and donors for action. Watch these videos (Commons Connect, Know Your Landscape) to understand the capability of the tools and the underlying datasets and algorithms. Various geospatial layers are being made available for generation and download via a pan-India Google Earth Engine application, the Landscape Explorer dashboard, and a Sub-district level GEE app.
Git-hub repo: https://github.com/orgs/core-stack-org/repositories
Technical manual: version 2 (Mar 2025), version 1 (Aug 2024)
Intra-annual land use and land cover classification
Our research group focuses on developing high-resolution (10m) intra-annual Land Use and Land Cover (LULC) classification maps tailored for dynamic landscape monitoring. Our classification scheme includes 12 LULC classes, comprising both static categories such as built-up areas, trees, barren lands, and shrubs & scrubs, as well as dynamic intra-annual classes. Notably, our maps capture water seasonality, which reflects the presence of water across different agricultural seasons, and cropping frequency classification, which determines the number of agricultural cycles a tract of land is used for.
The selection of these classes is driven by the need to track land cover changes with high temporal accuracy, ensuring timely insights for agricultural policy formulation and watershed management.
Our classification pipeline integrates both supervised and unsupervised techniques, optimized for efficiency and scalability. We enable large-scale pan-India LULC mapping while operating within the free-tier limits of platforms like Google Earth Engine (GEE). This ensures that researchers, policymakers, and stakeholders can execute and customize our classification workflows without requiring high-end computational infrastructure. We are working on the latest paper of this research work and will update the link soon.
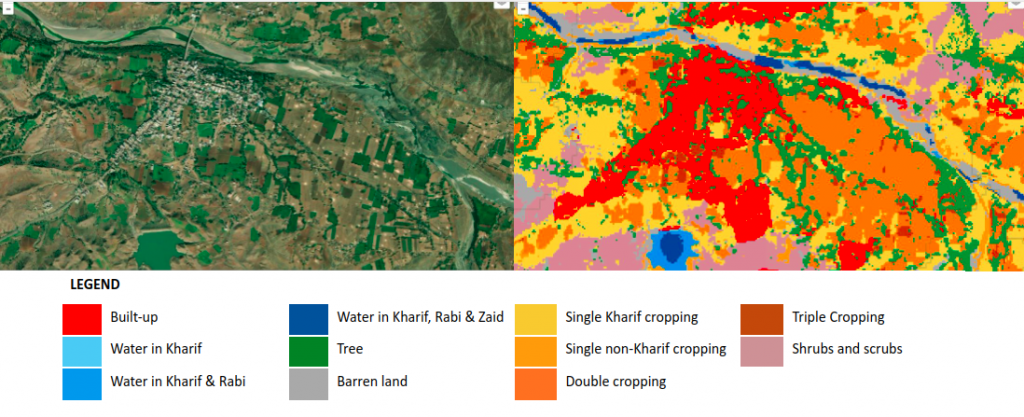
Example: LULC map of Barwani district in Madhya Pradesh for the hydrological years 2021.
- Paper: Bansal, Chahat, et al. “IndiaSat: A Pixel-Level Dataset for Land-Cover Classification on Three Satellite Systems-Landsat-7, Landsat-8, and Sentinel-2.” Proceedings of the 4th ACM SIGCAS Conference on Computing and Sustainable Societies. 2021. https://dl.acm.org/doi/pdf/10.1145/3460112.3471953
- Repo: https://github.com/ICTD-IITD/IndiaSAT_LULC_Deliverables
Tree cover monitoring
Forests and trees are the backbone to maintain our planet’s ecological balance, offering habitats, absorbing carbon dioxide, regulating climate, and sustaining biodiversity. Beyond traditional forests, small-scale plantations also play a vital role in rural livelihoods by enhancing agroforestry productivity and generating carbon credits. While restoration and conservation initiatives are underway, they require granular and timely insights into tree canopy health. However, tracking tree health indicators like canopy density and height over time has remained a challenging task, particularly in a country as ecologically diverse and vast as India. Modern remote sensing technologies allow us to move from static snapshots to near real-time, actionable insights, enabling stakeholders to implement timely interventions. We introduce a novel, scalable, and open-source framework for monitoring tree canopy density and height distribution across India using advanced remote sensing and machine learning techniques at a fine spatial resolution of 25m.
We have developed Agro-Climatic Zone (ACZ) specific spatiotemporally robust models, which outperform global models by tailoring insights to local conditions, and use openly available data from the Sentinel-1, Sentinel-2 and Global Ecosystem Dynamics Investigation (GEDI) satellite systems The outputs of our model can especially help forest departments, policymakers, and local communities to identify areas in need of restoration and to assess the effectiveness of ongoing conservation activities.

- Research Paper: Dhruvi Goyal, Harsh Singh Chauhan, and Aaditeshwar Seth. 2024. Scalable Monitoring of Tree Canopy Density and Height in India at High Spatial Resolutions. In The 13th International Conference on Information & Communication Technologies and Development (ICTD 2024). https://www.cse.iitd.ernet.in/~aseth/forest-health-ictd2024.pdf
- Github Repo: https://github.com/Dhruvi-Goyal/Tree-Health-Monitoring/
- GEE App: https://ee-ictd-dhruvi.projects.earthengine.app/view/tree-health-monitoring
Building A Vulnerability And Socioeconomic Index
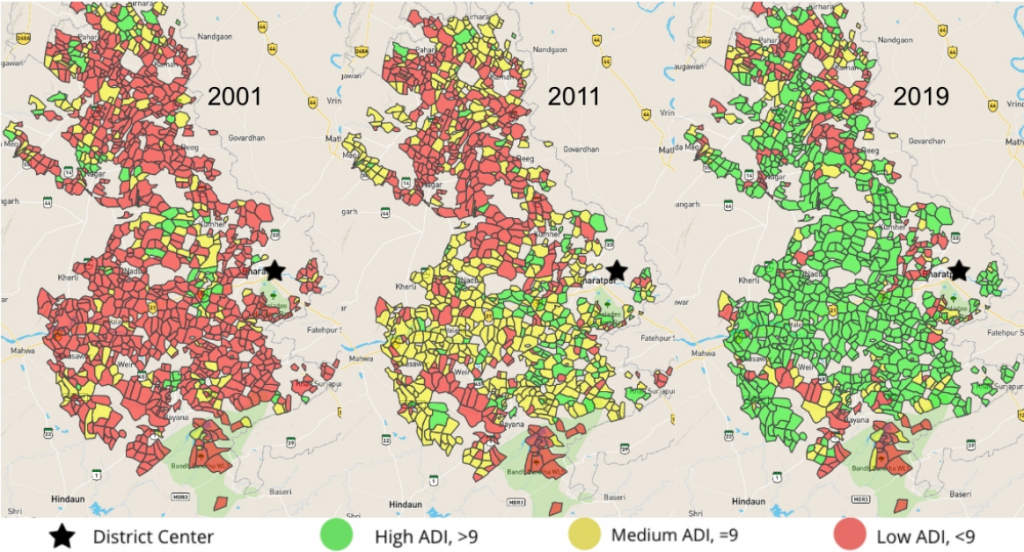
In the absence of regular censuses, socio-economic factors proxied using a wealth index can be obtained reasonably accurately from classifiers trained on satellite-based data. The figure below shows such a sample output from initial work by our group on poverty mapping. Detailed indicators related to the type of housing, primary source of drinking water, main source of lighting, source of fuel, asset ownership, etc. are aggregated into a composite wealth index at the village level, and tracked over a period of almost two decades from 2003 to 2019.
Research Paper
Tracking Socio-economic Development in Rural India Using Satellite Imagery. A. Gulgulia, A. Gupta, A.P. Sarashetti, A. Sinha, and A. Seth. ACM JCSS 2022. https://www.cse.iitd.ernet.in/~aseth/socio-econ-adi.pdf
GitHub-Repository
https://github.com/badri1995/ADI_complete
Impact assessment of water structures
Rainwater harvesting site assessment, for example, considers factors such as the soil type, slope, precipitation, soil moisture, land cover and land use. Remote-sensing data products of digital elevation maps and precipitation are now freely available. Machine learning-based land-cover classification algorithms that operate on freely available satellite imagery can provide high-resolution accurate maps, rapidly updatable. Soil moisture can similarly be estimated based on land surface temperature and vegetation indexes. We feel it is, therefore, feasible to conceive of a process whereby such datasets are used to identify candidate rainwater harvesting sites, fairness-based prioritizations are made to ensure the rights of vulnerable communities and participatory methods are then used to obtain community feedback and consensus to demand fund allocation for the identified sites.
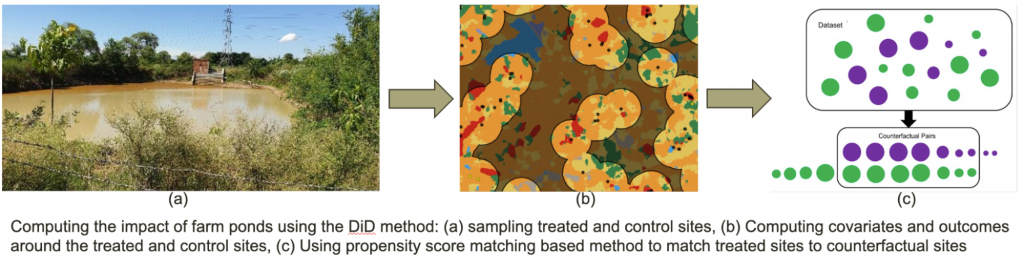
Our research group conducts impact studies to understand and quantify the impact of Natural Resource Management (NRM) structures such as farm ponds and check dams, on agricultural productivity and drought sensitivity. Previously, we conducted a study on the site-level impact of MGNREGA farm ponds in AEZ 13 of India based on the Difference-in-differences (DiD) method. We found that on average farm ponds have a positive and significant impact on crop yield in the monsoon season. Further, we also found that farm ponds can help reduce sensitivity to droughts for up to three weeks of drought incidence. Building on these findings, we conducted another study to understand the impact of farm ponds across the AEZs in India. In this study, we aim to understand the average treatment effect of farm ponds from a context-specific lens, based on the regional irrigation infrastructure in terms of the borewell and canal presence, prevalent farm pond typologies, prevalent crop types, and so on.
Further, we are implementing a Double ML (DML) based method to quantify the treatment effect of farm ponds across the different AEZs, and to build regional prediction models to predict the impact of prospective farm ponds based on their site-level features. We are also working on impact studies for check dams, wherein we have additionally worked on the identification of the zone of influence, which would give us more precise values for the treatment effect. Going forward, we plan to assess the landscape-level impacts of NRM structures
Research Paper
Assessing the impact of farm ponds on agricultural productivity in Northern India. 2024. Ramneek Kaur, Kshitiz Bansal, Devang Garg, Ramita Sardana, Saketh Vishnubhatla, Sanjali Agrawal, Shruti Kumari, Parag Singla, and Aaditeshwar Seth. In Proceedings of the 7th ACM SIGCAS/SIGCHI Conference on Computing and Sustainable Societies (COMPASS ’24) https://www.cse.iitd.ac.in/~aseth/farm-ponds.pdf
GitHub-Repository
https://github.com/SanyaKapoor/Site-Level-Impact-Assessment-of-Farm-Ponds
Farm boundaries
ince agriculture in most parts of India is rain-fed, global products like Dynamic World struggle to differentiate between agricultural land and scrubland. The error is evident in the areas of Surgana where a hilly but scrubby area, comprising a lot of fields in it, is classified mostly as scrubland. These classification errors hinder downstream tasks such as predicting cropping intensity on agricultural land. To address this, we developed a local compute pipeline that downloads high-resolution images at 1.19 m pixel resolution and applies computer vision models to segment the images into farmland, plantations, and scrubland.
Next, we designed an algorithm to classify these segments based on the insight that, unlike the irregularly shaped scrublands, agricultural fields exhibit either lower randomness—quantified by entropy measures—or structured planting patterns, which can be detected using techniques like the Hough transform. The resulting farmland, plantation, and scrubland boundaries are then converted into vector assets and uploaded to Google Earth Engine. Within our LULC pipeline, these vectors are used to refine downstream tasks, such as predicting cropping patterns exclusively within farm areas.

Research Paper
Coming soon.
GitHub-Repository
https://github.com/ramank1137/Scrubland-Field-Delineation
Detection of farm ponds and wells
Water resource management is critical for sustaining agriculture, particularly in regions prone to erratic rainfall and water scarcity. Traditional methods of monitoring water structures, such as farm ponds and wells, are often manual, labor-intensive, and inefficient for large-scale mapping. While satellite imagery has been used to study land use and hydrological changes, existing approaches struggle to accurately identify smaller water bodies across diverse landscapes. Addressing these challenges, we have built a deep learning-based framework to systematically detect, map, and analyze farm ponds and wells using high-resolution satellite imagery.
Our work integrates the YOLOv11 deep learning model with geospatial processing to develop an automated pipeline for identifying and geotagging water structures using high resolution satellite imagery and our model achieves high accuracy in detecting farm ponds and wells across different agroecological zones in India. The framework includes entropy-based filtering to reduce false positives, ensuring reliable detection across varied terrains. The geospatially processed results are converted into GeoJSON formats for seamless integration with GIS platforms, facilitating large-scale impact assessment. This automated approach has the potential to enable better resource planning, improve irrigation infrastructure monitoring, and support data-driven decision-making for sustainable water management in rural areas.
We are now using this output to build an irrigation profile of villages.
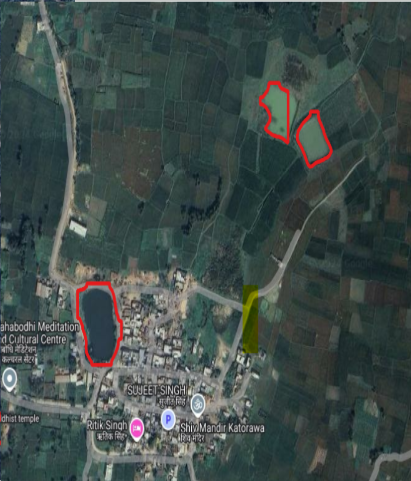
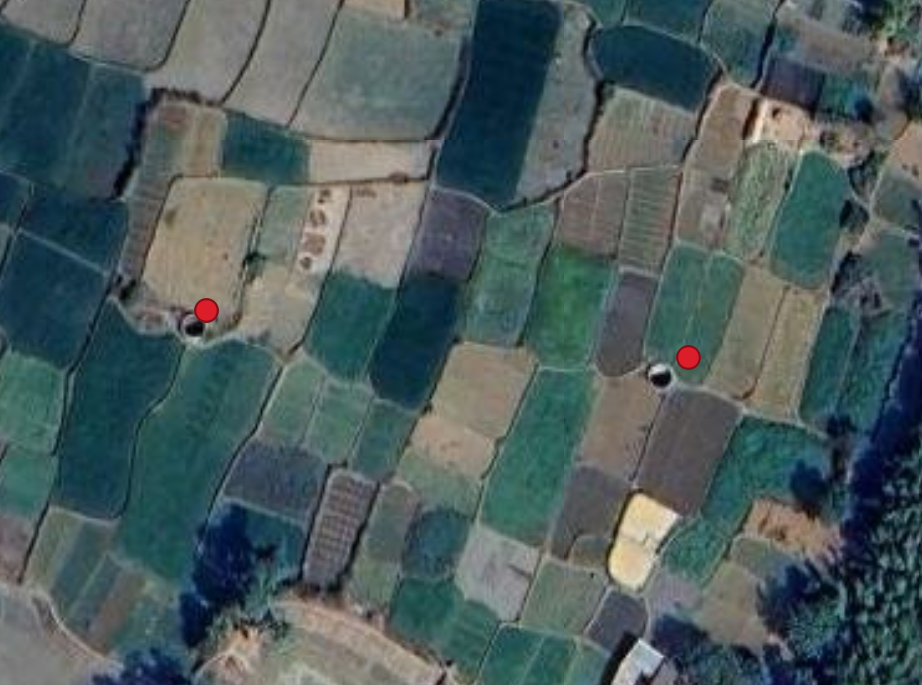
Example: Visualization of the outputs: farm ponds and wells
Research Paper
Coming soon.
GitHub-Repository
https://github.com/aatifnisar01/Ponds_and_wells_detection.git
Fairness In Funds Allocation
The objective of this research is to conduct an analysis of fairness of expenditure across different locations in the Mahatma Gandhi National Rural Employment Guarantee Scheme (MGNREGS). We build a framework and conduct an (almost) pan-India analysis using publicly available MGNREGS data to determine disparate treatment and disparate impact of different types, towards SC/ST groups, and uncover the prevalence of different processes through which this discrimination may be operating. The results can be used to define precise policy actions at the state, district, and panchayat levels, to counter this inequity. Further, even the identification of disparity in welfare allocation can be used to trigger corrective action.
We introduce disparate treatment and impact metrics for MGNREGS related to the efficiency of scheme coverage, intensity of scheme uptake, and scheme demand. We also build a unique characterization of panchayats (local administrative units) in terms of whether SC/ST population is dominant in the panchayat, and distributed across the villages of the panchayat or concentrated in a few villages or most villages. We have developed an inequity index as an indicator of inequity in fund allocation at panchayat, district, and state levels. The district-level inequity indices for scheduled caste and scheduled tribe are presented on the map where a value 1 indicates less inequity and 5 indicates a high level of inequity. Analysis of treatment and impact metrics in these different categories of panchayats helps point towards different processes through which discrimination could be operating, such as through local elite capture by dominant castes or through administrative apathy at higher bureaucratic levels.
Ultimately, the research aims to develop a model to estimate an optimal allocation of funds to promote equitable development among the panchayats. The model will take into account various factors such as the socio-economic and demographic characteristics of each panchayat, its developmental needs, and historical funding patterns to ensure that the allocation of funds is fair and just.

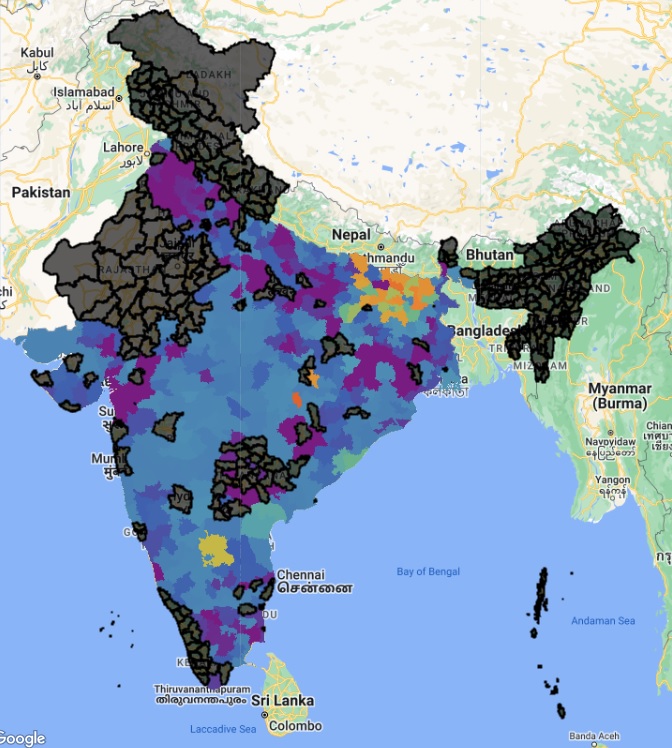

District-level SC inequity index

District-level SC inequity index
Research Paper
Ashima Mittal, Chintan Sheth, and Aaditeshwar Seth. 2024. An In-depth Analysis of Caste-based Inequity in Welfare Allocation in the National Rural Employment Guarantee Scheme in India. The 13th International Conference on Information & Communication Technologies and Development (ICTD 2024), December 09–11, 2024, Nairobi, Kenya. https://www.cse.iitd.ernet.in/~aseth/caste-based-ictd2024.pdf
GitHub-Repository
https://drive.google.com/drive/folders/1Ouhxz_JELRiboXDXzlc2ZG1Q935AN7uB?usp=drive_link (for welfare metrics at Panchayat, District, and State-level)
https://drive.google.com/drive/folders/1tm8EHY3mClWOsuV5obGBXtr5kqBhYxCA?usp=drive_link (for MIS parameters)
Site assessment for water structures
The Mahatma Gandhi National Rural Employment Guarantee Act (MGNREGA) was enacted in 2005 to provide 100 days of wage employment per year to rural households willing to perform unskilled manual labor. The labour is specifically meant to be towards the creation of durable assets such as farm ponds, check dams, percolation tanks, and irrigation channels to strengthen water security in the rural landscapes.
Site selection for the construction of water assets usually takes into account the proximity of the site to farmlands, but may neglect geological factors such as the presence of lineaments or the infiltration rates and storage capacity of the underlying lithology. This can lead to the selection of improper sites. Such misidentification of suitable sites indeed results in many non-operational structures. To improve the site selection with scientific evidence, a tool called Composite Land Assessment and Restoration Tool (CLART) was developed by the CSO, Foundation for Ecological Security (FES), which provides an assessment of areas suitable for good, moderate, or low groundwater recharge. CLART primarily uses geological layers based on lithology, lineaments, drainage density, and slope, to assess this site suitability. Demands keyed into CLART are associated with a recharge suitability score and conveyed to MGNREGA or other schemes for allocations.
Experienced CSO field staff and volunteers also indicated that in addition to seeing the recharge potential at a particular site, as indicated by the CLART layer, the exact slope at that point and a comparison with the surrounding slope, would be useful to judge runoff accumulation capacity for the site. We plan to provide site-level assessment in our Commons Connect planning tool that incorporates the CLART layer and augments site assessment further by using site-level indicators to corroborate community demands. Site-level indicators that could be useful include an estimate of the catchment area draining into the point, identify natural depressions for constructing potential waterbodies, distance to the nearest drainage line, areas under the influence of various stream orders and the sensitivity of runoff accumulation to drought and non-drought years. Feedback on our ongoing work on determining the impact of new water bodies on downstream water bodies using the simulation method was also found to be quite relevant during field testing of Commons Connect tool.
Research Paper
- Shivani Mehta, et al. Initial Observations from Field Testing of a Digital Participatory Tool to Improve Water Security in Rural India. ICTD 2024, Nairobi, Kenya. https://www.cse.iitd.ernet.in/%7Easeth/commons-connect-ictd2024.pdf
GitHub-Repository
Coming soon.
Hosting:
| Site-level layer | Spatial resolution | Temporal resolution | Google drive folder | Github repository | Spatialunit ofavailability /computation |
| CLART | 30m | static | – | Programmable CLART | Computed at pixel level |
| Upstream-downstream water bodies | – | annual | – | Upstream-downstream water bodies | Computed at block level |
| Stream order raster | 30m | static | Stream_Order_Raster_India | – | Pan India |
| Distance to upstream drainage line | 30m | static | Distance to upstream drainage line | – | Pan India |
| Catchment area | 30m | static | Catchment area | – | Pan India |
| Natural depressions | 30m | static | Natural depressions | – | Pan India |
| Runoff accumulation | 30m | static | – | xxx | Computed at pixel level |
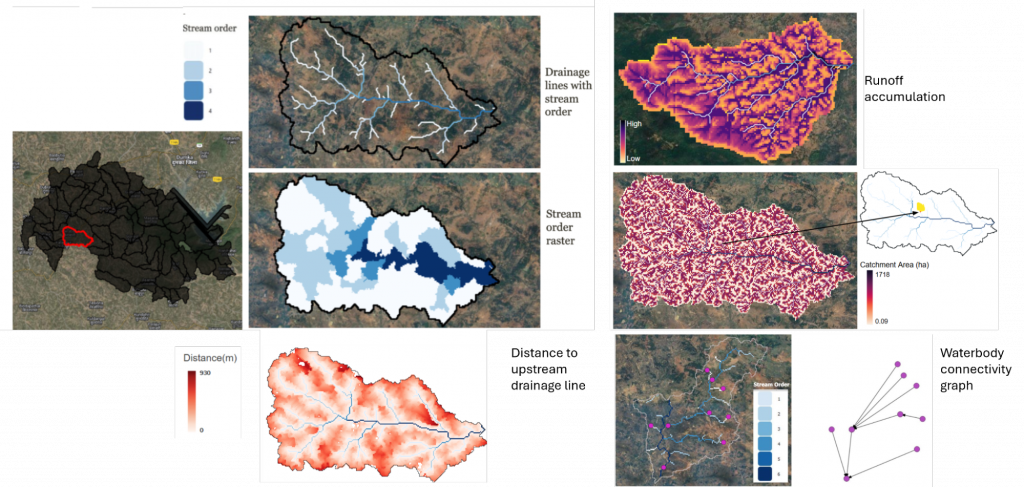
watershed (highlighted in red) in the Masalia block in Dumka district of Jharkhand.
Site assessment for tree plantations
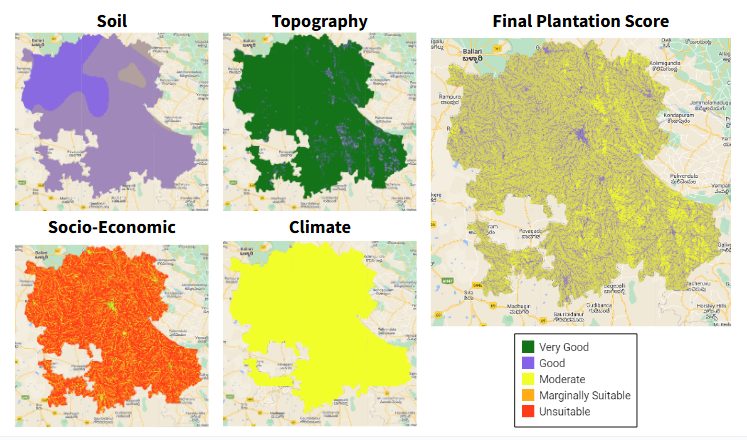
This research work focuses on building a participatory tool for assessing the land suitability for tree plantations and further recommend the best suitable tree species for the selected site that caters to the community’s environmental & economical needs. It leverages multiple soil, terrain, ecology, climate and socio-economic landscape characteristics of the region to generate the plantation feasibility map. The data for all these characteristics are derived by processing high resolution open-source satellite imageries using remote sensing and machine learning techniques. We currently take weights of different features as input from the users/collaborators in their area of interest and do a weighted aggregation of the considered features to propose the site suitability for agroforestry plantation, based on the methodology described in (Nath et al. 2021).
We are also building a model to assess the plantation’s health over time, by estimating the vegetation density, growth in canopy height and carbon sequestered with time. This would facilitate the farmers, NGOs, government officials and other organizational bodies to analyze the impact of the undertaken tree plantation projects in different sites.
Additionally, we are making a similar attempt to identify sites requiring restoration support, and creating Species Distribution Models (SDMs) that can help us assess the survival rate of species at these sites based on the local (and projected) climatic and ecological characteristics.
Research Paper
Coming Soon.
GitHub-Repository
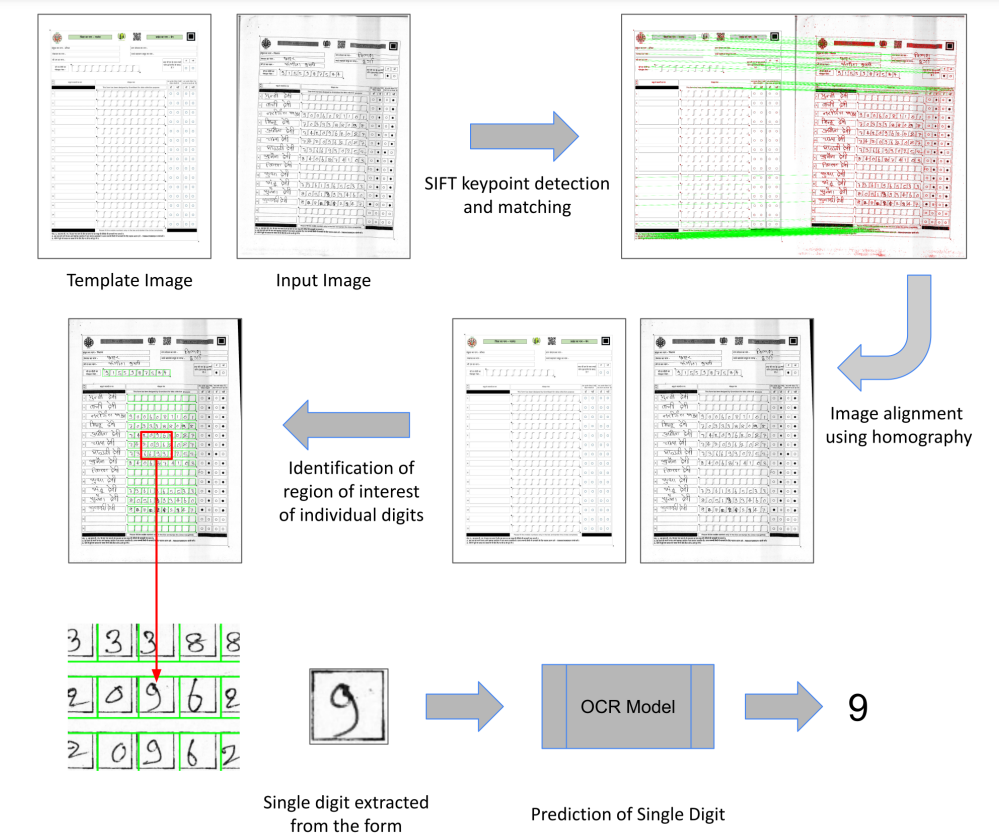
Smartforms: Optical scanning of paper forms for quick digitization of data and on-boarding of users
Data collection through digital devices may not always be feasible for reasons such as the unaffordability of smartphones and tablets by field-based cadre or shortfalls in training and capacity building. Paper-based data collection has been argued to be more appropriate in several contexts, with automated digitisation of the paper forms through OCR (Optical Character Recognition) and OMR (Optical Mark Recognition) techniques. We contribute by providing a large dataset of handwritten digits, and deep learning-based models and methods built using this data, that are effective in real-world environments.
Research Paper
Use of Metric Learning for the Recognition of Handwritten Digits, and its Application to Increase the Outreach of Voice-based Communication Platforms – D. Pant, D. Talukder, D. Kumar, P. Pandey, A. Seth, and C. Arora. ACM COMPASS, 2022.
GitHub-Repository
https://github.com/Smartforms2022/Smartforms
Mobile Vaani: Voice-based community media
The IVR channel is popular among rural and low-income groups, while an app and WhatsApp messenger are available for smartphone users. Voice messages are moderated by local volunteers and Gram Vaani’s team. Acceptable messages are published on the platform for others to hear. Each platform is independent and coordinated by local volunteers who assist with social entitlements and public services. Incentives motivate volunteers to contribute to community development and acquire skills. Mobile Vaani has a strong reputation for providing credible information and assisting marginalised groups.
Research Papers
Design Lessons from Creating a Mobile-based Community Media Platform in Rural India – A. Moitra, V. Das, A. Kumar, Gram Vaani, and A. Seth.
ICTD 2016.
Findings from a Civil Society Mediated and Technology Assisted Grievance Redressal Model in Rural India – D. Chakraborty, S. Ahmad, and A. Seth.
ICTD, 2017
Costs and Benefits of Conducting Voice-based Surveys Versus Keypress-based Surveys on Interactive Voice Response Systems – A. Khullar, P. Hitesh, S. Rahman, D. Kumar, R. Pandey, P. Kumar, R. Tripathi, Prince, A.A. Jha, Himanshu, and A. Seth.
ACM COMPASS, 2021.
Experiences with the Introduction of AI-based Tools for Moderation Automation of Voice-based Participatory Media Forums – A. Khullar, P. Panjal, R. Pandey, A. Burnwal, P. Raj, A.A. Jha, P. Hitesh, R.J. Reddy, Himanshu, and A. Seth.
India HCI, 2021.
Early Results from Automating Voice-based Question-Answering Services Among Low-income Populations in India – A. Khullar, M. Santosh, P. Kumar, S. Rahman, R. Tripathi, D. Kumar, S. Saini, R. Pandey, and A. Seth.
ACM COMPASS, 2021.
GitHub-Repository
Farmphone
FarmPhone technology solution will be built on top of the Mobile Vaani platform, an open-source enterprise resource planning system (customised for FarmPhone), and WhatsApp enabled front end for connecting customers.
- Mobile Vaani platform shall offer a dedicated bidirectional IVRS communication channel for farmers and Farmers’ organisations (Co-operatives, FPOs etc.). The platform shall connect farmers over mobile phones (feature and smartphones) to provide access to market information, knowledge, and post-harvest activities supported by Cooperatives. The platform shall be enabled with speech2text protocols to enable them to share their produce-related details in vernacular languages.
- An open-source ERP system to enable cooperatives to register the sale requests, improve traceability/transparency in the value chains, set up processes for procurements, track transactions and build health indicators for cooperatives – profits realised, corpus size, corpus utilisation. The functionality of Cooperative ERP:
- Farmers (sellers) services – IVR and WA channels register their produce to sell.
- Registration request for selling – IVR based survey for selected crops: type of produce, quantity available, and quality (optional)
- One-time registration through – ODK/Web-based registration by coop, WA, IVR (limited info), validation of registration by coop (Mobile Number, location, farmer registration number) for future transactions (transaction receipts, payment receipts)
- Communication with the farmer – IVR (Interactive Voice Response) system to push advisory messages to farmers, surveys, announcements, federation meeting minutes, and also for farmers to ask questions
- Verification, transport and selling transactions – Web mobile
- Registered request by farmers – notify or view all the sell requests, including details of a farmer, produce for verification and confirmation of the type, quantity and quality
- Procurement confirmation to coop – Sale receipt shared over SMS or WA
- Payment to farmers – Payment status options: Full advance payment made, partial advance payment made, commodity picked up, full payment made after delivery, etc. Sharing payment details over SMS or WA shall also be explored.
- Buyers (bulk buyers/local shops) – WA-based service (Primary),
- View the catalogue of bulk produce (unpackaged) – including product name, product type, quantity and price
- Registered buyers can get product notifications from Coop via WhatsApp and order on WA or IVR calls. This is a functionality for the front-end ERP for products.
- Farmers (sellers) services – IVR and WA channels register their produce to sell.
- WhatsApp enabled frontend – Augmenting the frontend with Whatsapp for consumer order placement. Additional channel for smartphone users/customers to explore the available products and place orders. Registered buyers can get notifications on products available from Coop via WhatsApp and can connect with Cooperatives over WA or IVR calls for purchasing commodities in bulk quantities.
Research Papers
Coming soon.
GitHub-Repository
Coming soon.
How To’s
Coming soon.
Commodity price forecasting application
Small and marginal farmers often find it hard to get a good price for their produce because of several logistical and contextual challenges they face in market participation. Aggregating produce via farmer cooperatives and being able to time the sales for non-perishable crops when market prices are high has emerged as a useful strategy for farmers. In our study, we work with a network of farmer cooperatives in India growing soybeans and explore the potential of developing a machine learning-based price forecasting and sales recommendation system that produces suggestions on the best dates for soybean sales should be made. Our expectation is that such a tool will provide useful indicators to farmer cooperatives on whether to sell their stored produce right away (if prices are likely to fall in the future) or to wait (if prices are likely to rise).
We present an evaluation of different methods for price forecasting and a prospect theory-based method to produce sales recommendations. Experiments on historical data indicate that we can provide modest gains to farmers, and we build and field test an Android application in collaboration with our field partners. Early results indicate positive feedback. Our methods can be generalized beyond soybean to other agricultural commodities that can be stored for several months and help farmer cooperatives to compete effectively in agricultural markets.
Research Papers
https://dl.acm.org/doi/full/10.1145/3609262
GitHub-Repository
https://github.com/souraavv/ai-based-market-intelligence-system
How To’s
Coming soon.