To accompany the CoRE stack innovation challenge, we have enhanced the starter-kit with an example of combining data from the CoRE stack GEE assets with the CoRE stack APIs. This example takes a use-case of river rejuvenation in the Sunderpahari block in Godda district, Jharkhand. As the name exemplifies, the area has beautiful forested hills from which rivers originate, combine into the Kajhiya river, and which eventually flows into the Ganga.
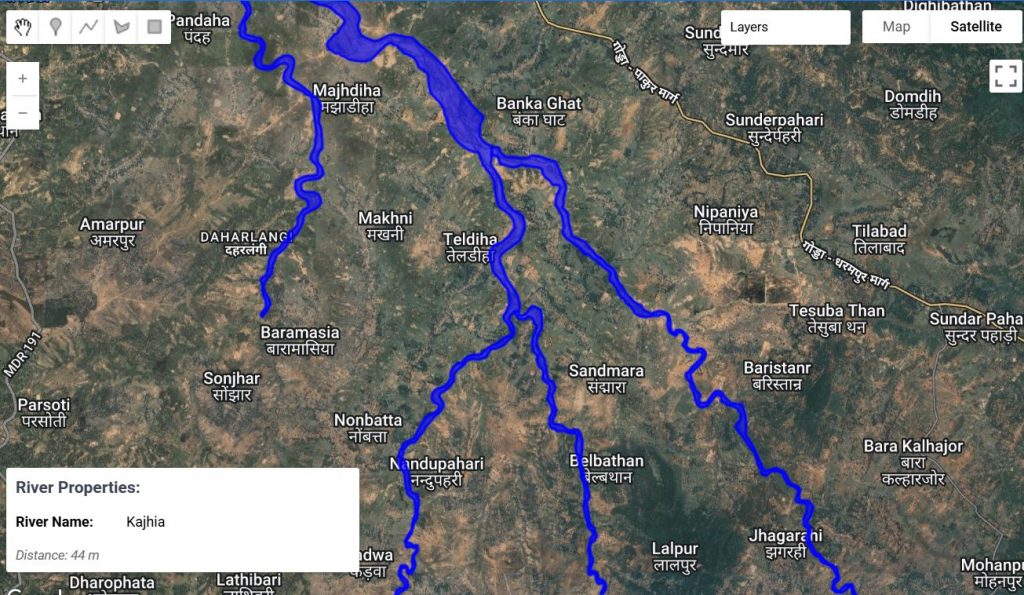
Despite being in close proximity to rivers, there is dire water shortage in the area, partly due to deforestation in the hills which results in the streams drying up sooner and not lasting into the summers, partly due to rampant sand mining that impacts the hydrological function of the river, and partly due to the topology of the area where hamlets located in up-land areas are not able to retain water.
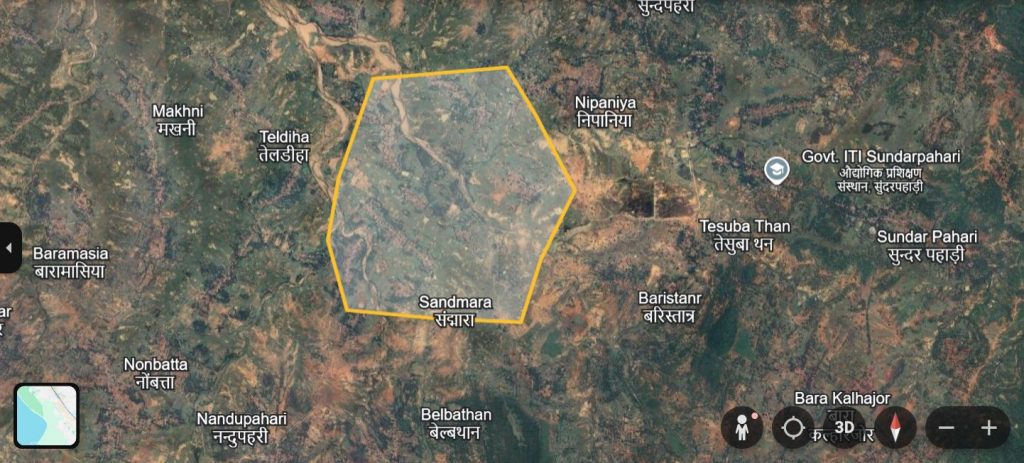
Consider a hypothetical environmental and development project to rejuvenate a stretch of river in the villages of Nipaniya and Sandmara, to improve water availability. What key datapoints and other areas should be studied to plan well for the project? In this example, we show how for a given area of interest, we can identify upstream and downstream micro-watersheds, and get some basic data about water availability and deforestation, using the CoRE stack datasets and APIs.
We intersect the given area of interest with the CoRE stack micro-watershed registry to identify the immediate intersecting micro-watersheds, then refer to the CoRE stack micro-watershed connectivity graph to identify up to three levels of upstream micro-watersheds that drain into these ones, and up to one level of downstream micro-watersheds.
Note that the map below is rendered inside an iframe which fetches content hosted on a different domain. Your browser will prompt for permission to allow access.
Or alternatively, you can also directly access the map here.
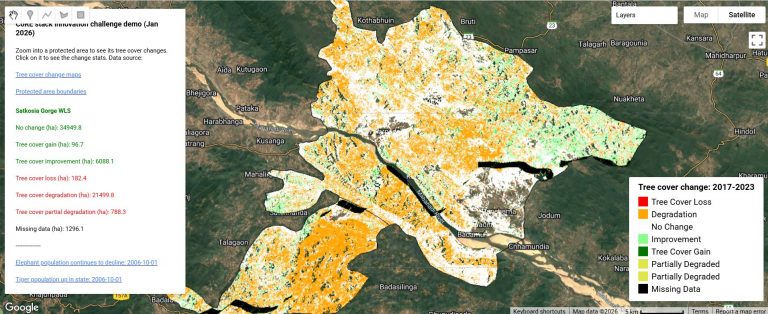
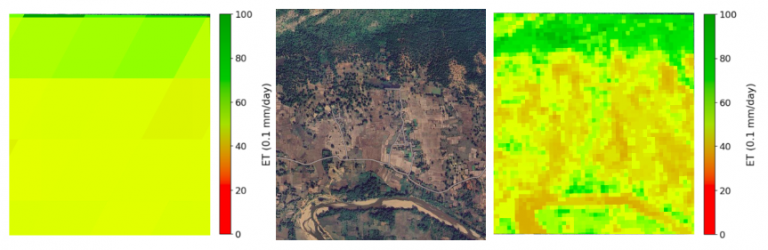
The flow direction is shown through arrows. And CoRE stack APIs are used to pull data for these micro-watersheds which can be seen by clicking the micro-watersheds. Quite interestingly, some micro-watersheds despite deforestation have seen steady surface water levels, some see depleting water levels, and some see a fluctuating behavior mostly in line with the rainfall which was poor in 2021 and 2022. The screenshots below show such micro-watersheds and their linked detailed reports can be accessed from the Know Your Landscape dashboard. Tracing micro-watersheds along the flow direction can help understand that for micro-watersheds showing low resilience, which upstream catchment micro-watersheds should also be treated. For the target villages of Nipaniya and Sandmara spanning micro-watersheds 12_306637, 12_308006, and 12_308299, the first two have water availability varying in tandem with rainfall and treatment in their upstream micro-watersheds may help, while the other is a head micro-watershed that is quite precarious and has steadily decreasing water availability.
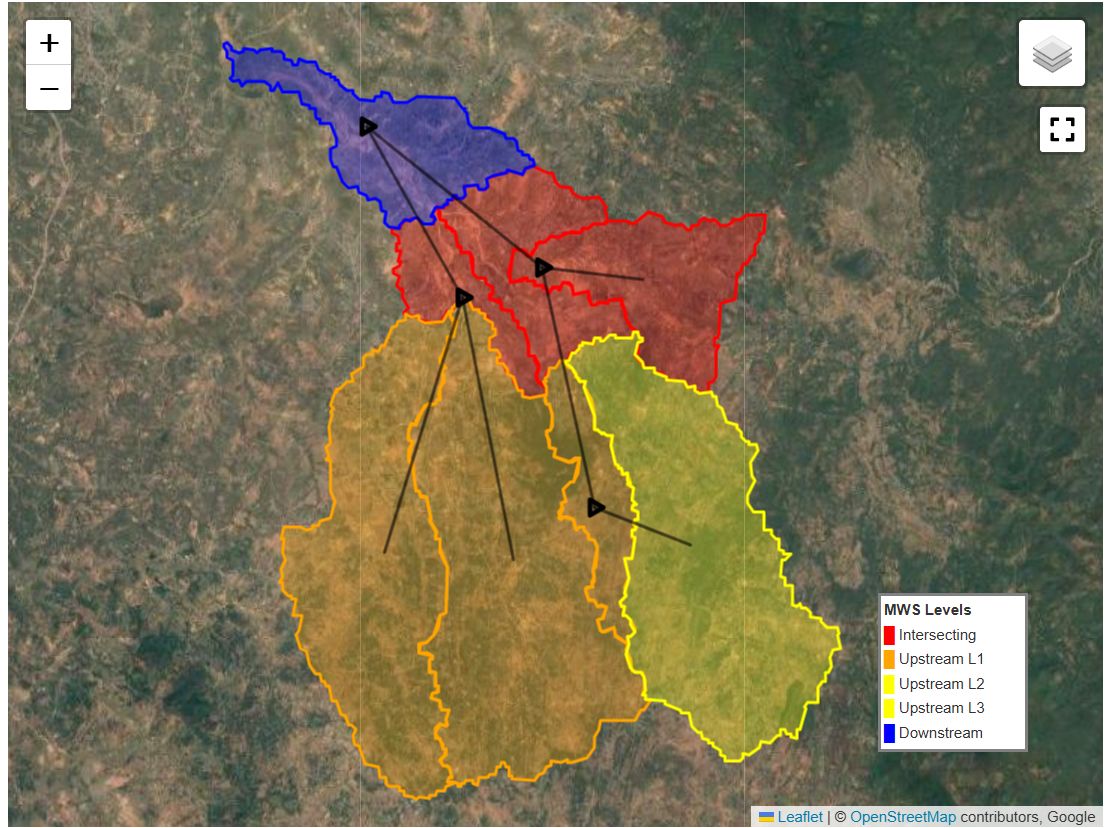 | 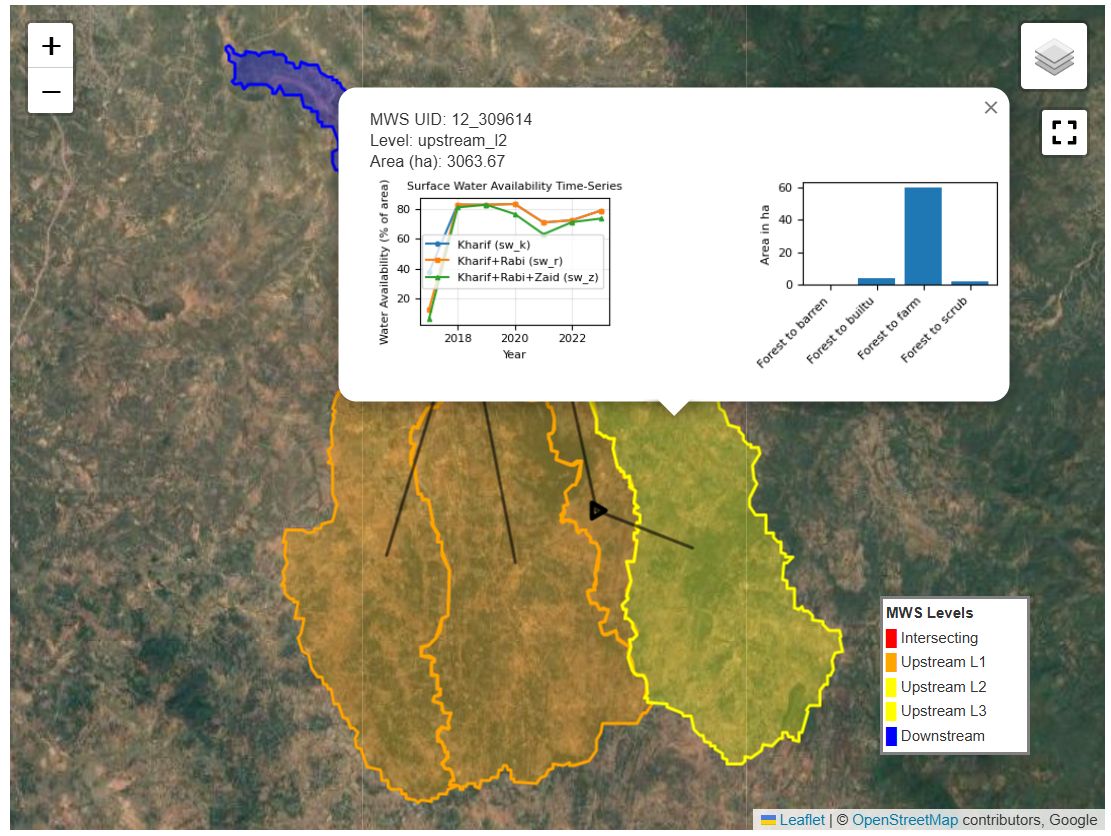 |
| Connectivity graph between micro-watersheds showing the flow of surface water | Example of a steady micro-watershed |
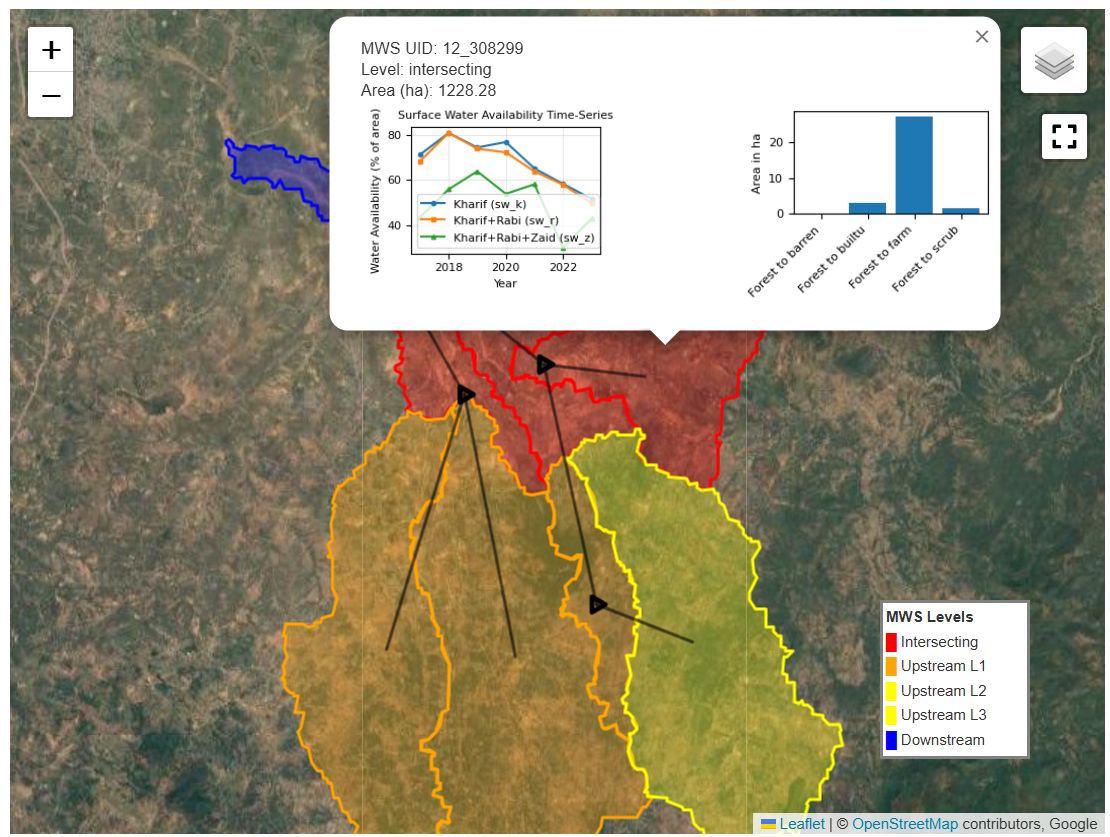 | 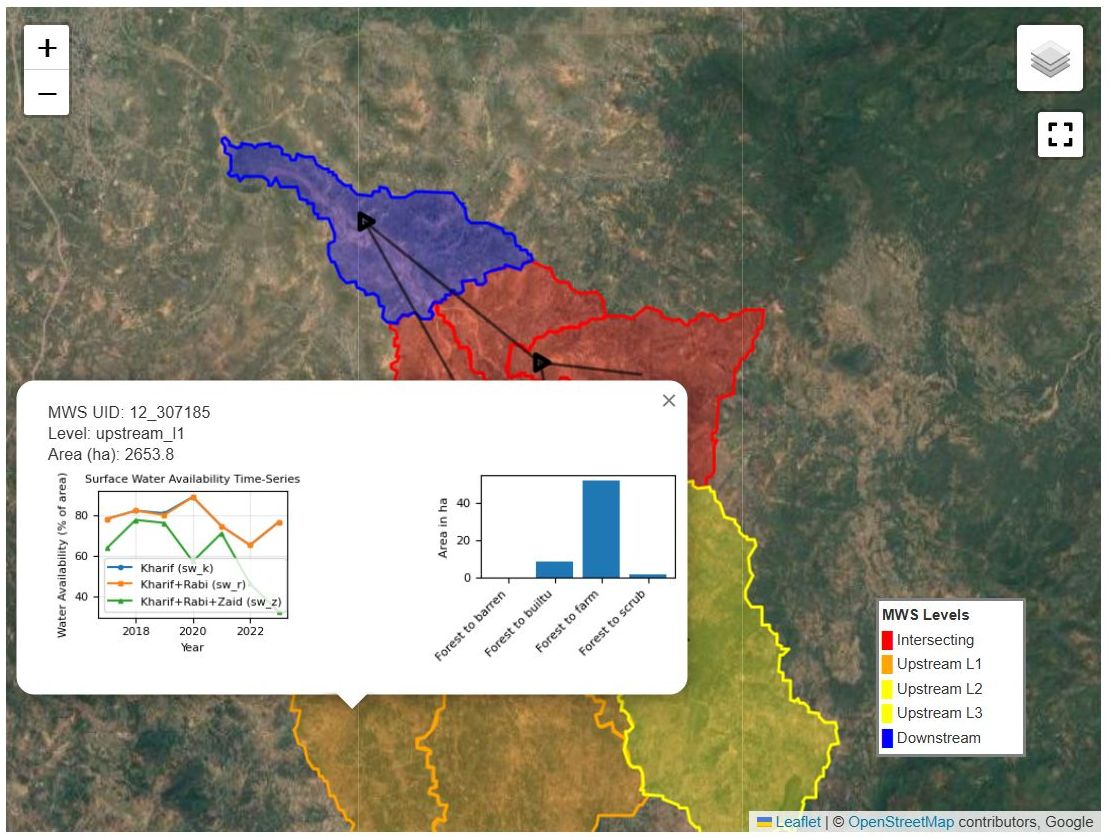 |
| Example of a declining micro-watershed | Example of a micro-watershed moving in tandem with the rainfall |
This is a demonstration of how interactive tools can be created for specific use-cases. Check the CoRE stack challenge github repo to learn the internals.
python core_stack_mws_intersections.py

The script can be changed to specify an area of interest as a GeoJSON. Then it will fetch all necessary data and generate a map in ./data/
Do check out the starter-kit to understand the CoRE stack data structure and how to pull in data from various underlying geospatial layers, the APIs which can provide even easier access to many key datapoints, STAC specs to understand the data, the logic behind the micro-watershed registry, and participate in the innovation challenge to build such point-specific tools.
For more discussions, please join the Googlegroup and Discord channel, and participate in weekly community calls on Fridays 3-4pm IST.