Forests and plantations are the backbone of our planet’s ecological balance, offering habitats, absorbing carbon dioxide, regulating climate, and sustaining biodiversity. Beyond traditional forests, small-scale plantations also play a vital role in rural livelihoods by enhancing agroforestry productivity and generating carbon credits. While restoration and conservation initiatives are underway, they require granular and timely insights into tree canopy health. However, tracking tree health indicators like canopy density and height over time has remained a challenging task, particularly in a country as ecologically diverse and vast as India. Traditional tree monitoring methods have often been limited by their manual, time-intensive nature. In an era of climate urgency, this delay can limit the effectiveness of conservation and restoration initiatives. Modern remote sensing technologies allow us to move from static snapshots to near real-time, actionable insights, enabling stakeholders to implement timely interventions. Our recently published paper entitled “Scalable Monitoring of Tree Canopy Density and Height in India at High Spatial Resolutions”, presented at the ICTD 2024 introduces a novel, scalable, and open-source framework for monitoring tree health across India using advanced remote sensing and machine learning techniques at a fine spatial resolution of 25m.
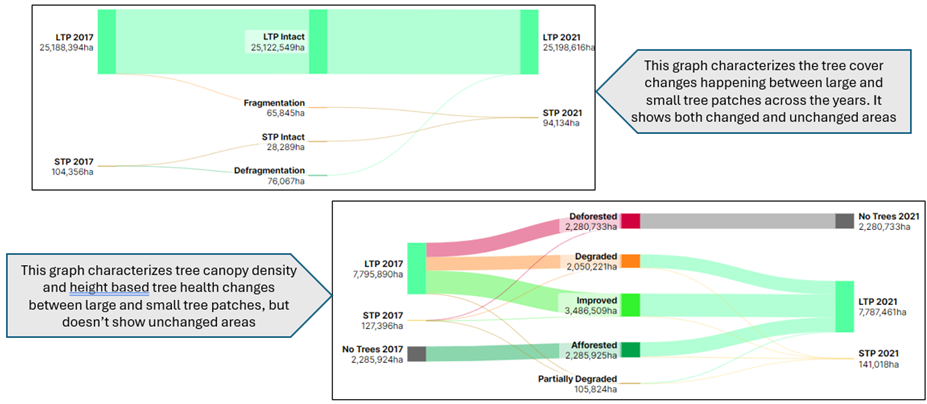
We have developed Agro-Climatic Zone (ACZ) specific spatiotemporally robust models, which outperform global models by tailoring insights to local conditions, and use openly available data from the Sentinel-1, Sentinel-2 and Global Ecosystem Dynamics Investigation (GEDI) satellite systems. We further categorized tree cover into Large Tree Patches (LTP) of 1 hectare of tree presence that usually have more than 10% canopy density and Small Tree Patches (STP) of less than 1 hectare of tree presence, and disaggregated tree health changes to better understand whether improvements or degradations are happening in forests or trees outside forests. The outputs of our model can especially help forest departments, policymakers, and local communities to identify areas in need of restoration and to assess the effectiveness of ongoing conservation activities. The outputs are available as an app on Google Earth Engine.
Methodology Overview
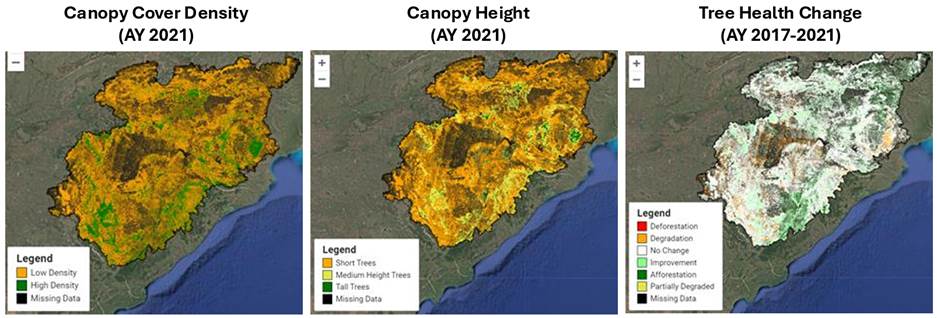
At the core of our research lies the integration of diverse satellite datasets and advanced machine learning techniques to predict tree health indicators: Canopy Cover Density (CCD) and Canopy Height (CH) Distribution. The methodology includes:
- Data Integration: We combined GEDI LiDAR datasets with Sentinel-1 SAR and Sentinel-2 optical imagery. The GEDI dataset serves as our ground truth for canopy metrics, while Sentinel-1 (SAR) and Sentinel-2 (optical) data provided high-resolution spatial coverage across years and is used to predict the tree canopy indicators. We utilized Agricultural Year (AY) 2019 and 2020 data for modelling, and AY 2021 data was out-of-sample dataset which was used to test the temporal robustness of models.
- Machine Learning Models: We trained XGBoost models for predicting CCD and CH distributions (median, 75th percentile, and maximum heights). These models were trained using 80% of the data (AY 2019-2020), validated on the remaining 20%, and tested on out-of-sample temporal datasets (AY 2021).
- Temporal Stability Analysis: We developed a correction mechanism to mitigate temporal output fluctuations caused by differences in data availability or quality, ensuring reliable long-term monitoring.
- Change Analysis Framework: Beyond yearly predictions, we implemented a systematic framework to detect and classify changes in tree health over time, distinguishing between deforestation, afforestation, improvement, and degradation.
Our models outperform existing baseline methods such as NDVI-based approaches and global models like GLAD for CCD and CH predictions in a year, with an accuracy of the order of 70% for most ACZs. The macro F1 score, which balances performance across all classes, was the primary evaluation metric. While a slight 2–6% accuracy deterioration was observed in AY 2021 results as compared to test data, the models remained significantly more accurate than baseline methods, making them reliable for future predictions. Additionally, for deforestation detection, our method achieved an impressive 97.86% accuracy.
Trees Cover Health Analysis in India
This section presents key results from our tree health analysis, including detailed change maps and aggregate statistics for different Agro-Climatic Zones (ACZs) in India. These outputs provide a comprehensive view of the state of forests and tree cover across the country.
Example 1: Tracking changes in a forest patch – Dongariya Village, Balaghat District, Madhya Pradesh
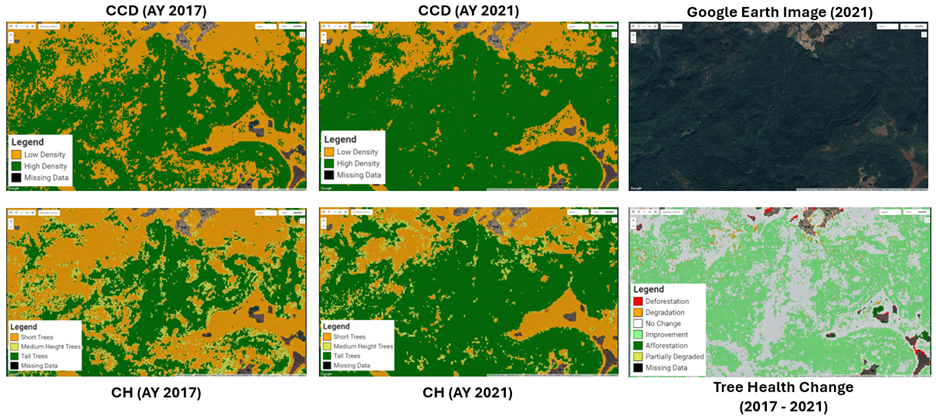
Balaghat district, with approximately 80% forest cover, is dominated by Sal, Teak, and Bamboo trees. Results from this region show significant canopy density improvement and tree height growth over the years, with minimal localized degradation. This indicates an overall enhancement in tree health, aligning with reported restoration activities in the area.
Example 2: Tracking changes at an ACZ level – Tree Health Change (AY 2017 – 2021) Statistics of Southern Plateau and Hills Region (ACZ-10)
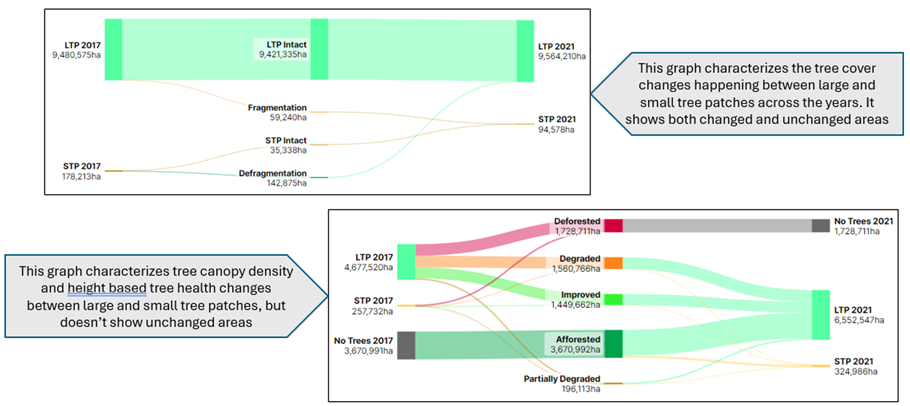
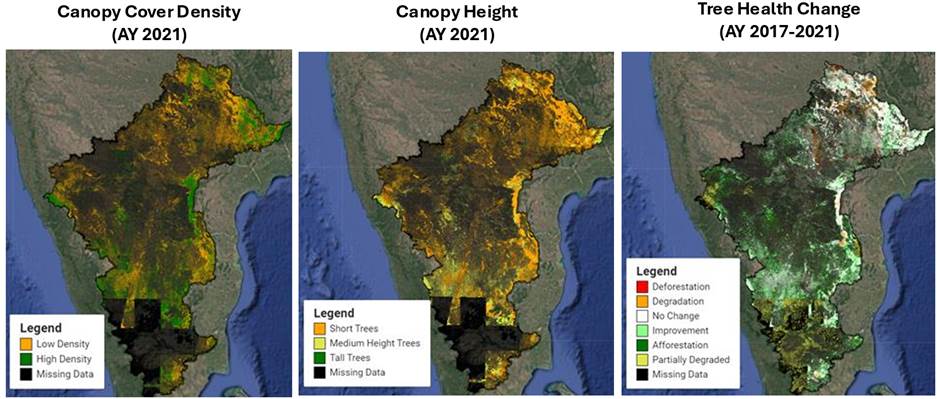
From AY 2017 to AY 2021, we computed tree health changes across all 11 Agro-Climatic Zones (ACZs) in India, revealing significant regional trends. The Southern Plateau and Hills Region (ACZ-10) recorded the highest afforestation, with 3,672 kha of new tree cover. On the other hand, the Eastern Plateau and Hills Region (ACZ-7) showed the highest deforestation (2,281 kha) and degradation (2,050 kha), reflecting widespread forest loss and degradation in parts of Odisha and Chhattisgarh. Despite these losses, ACZ-7 also saw substantial improvements in tree health (3,487 kha), indicating localized afforestation efforts that offset some of the deforestation.
The detailed results for each ACZ can be found in the slides. The detailed tree health change statistics can be observed in the below examples 2 and 3 for ACZ-10 and ACZ-7 respectively.
Example 3: Tracking changes at an ACZ level – Tree Health Change (AY 2017 – 2021) Statistics of Eastern Plateau and Hills Region (ACZ-7)
The Forest Survey of India recently released a report on forest changes between 2021 to 2023[AS1] . Our results are hard to directly compare with those by FSI because the thresholds to classify tree cover into distinct categories are different in both the studies. FSI uses static thresholds Pan India to classify trees into very dense forests, medium dense forests, open forests, and scrubs. In contrast, we use thresholds specific to the ACZ to categorize trees into low vs high density and study changes in context to local ecosystems. Additionally, inconsistencies were observed between the tree cover reported under different categories for AY 2019 in IFSR 2021 and IFSR 2023, of up to 1000 sq.km., which also brings up discrepancies in the long-term tree health change assessments. Our work demonstrates that it is indeed possible to build open models and provide forest change outputs which can be validated by civil society organizations and researchers to potentially improve the outputs and models over time, rather than provide opaque reports.
Request for feedback
We encourage researchers to examine our outputs and give feedback. Our tree cover datasets for different years are available on GEE, which is openly accessible to download and use. We would appreciate your feedback especially for the areas with which you are familiar. Please report any inconsistencies observed in any region by filling out this form.
Known limitations
Detection of tree presence is currently done via Dynamic World which tends to under-estimate tree cover. We are fixing this by computing the outputs over the IndiaSAT LULC that does better in tree detection, and it will change some deforestation and afforestation data. But in the meantime, improvement and degradation within tree cover areas can still be analyzed. Another limitation is that in several ACZs there is significant missing satellite data and therefore the trend numbers should be interpreted carefully.
Next Steps
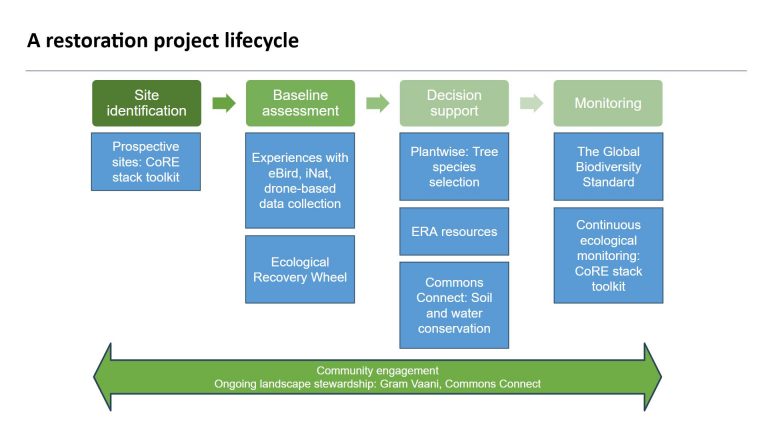
This work offers a scalable, open-source solution for monitoring tree health at fine spatial scales. To make this research accessible to all, we plan to integrate our outputs into the CommonsConnect and Know Your Landscape applications of the CoRE stack. This app will empower forest communities and local authorities to monitor tree cover in their regions, identify restoration sites and adopt sustainable practices. It will assist the Forest Department, NGOs and policy makers in analyzing trends from the aggregated output maps and planning interventions at the state or district level. It also enables data-driven tracking of forest areas under Community Forest Rights (CFRs).
Our work presents an open-source, scalable framework for monitoring tree health across India. Our methods not only deliver year-on-year predictions but also enable a nuanced understanding of changes in tree health over time. The insights gained can support local forest communities, policymakers, and restoration practitioners in making science-backed decisions to preserve and enhance India’s tree cover.