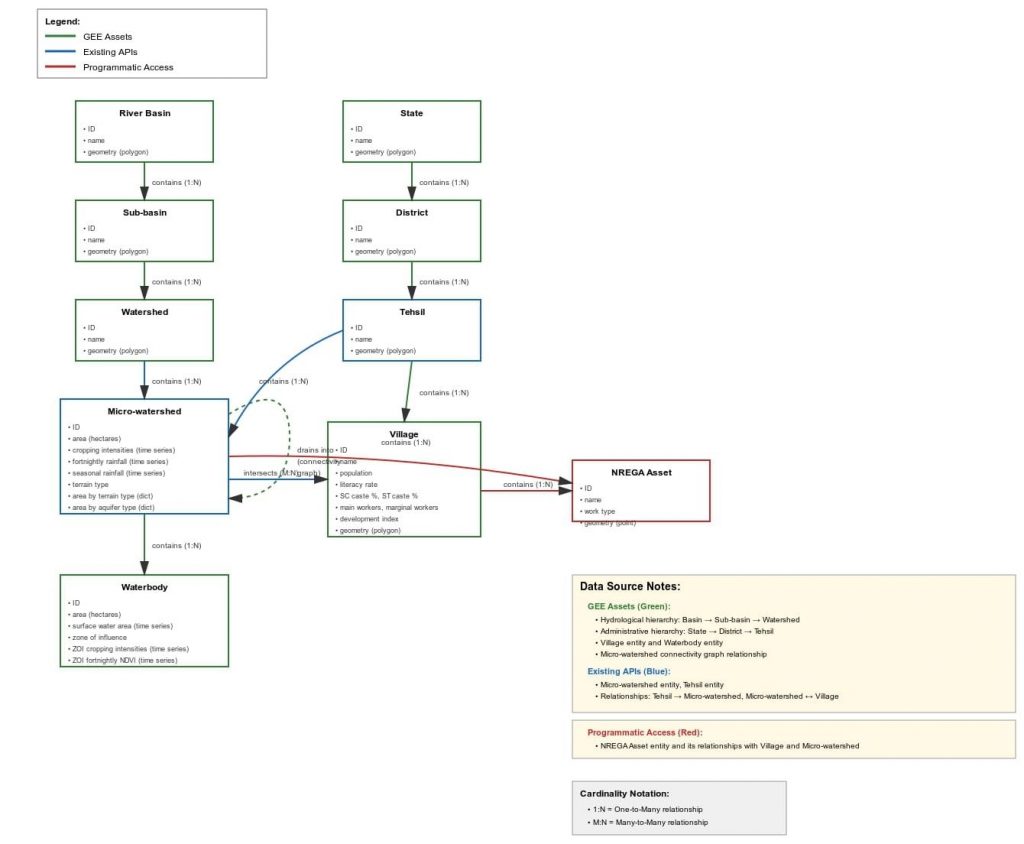
To accompany the innovation challenge (main doc with example problems), this ER diagram helpfully generated by Claude.ai (see chat) will be useful to understand the underlying CoRE stack data structure.
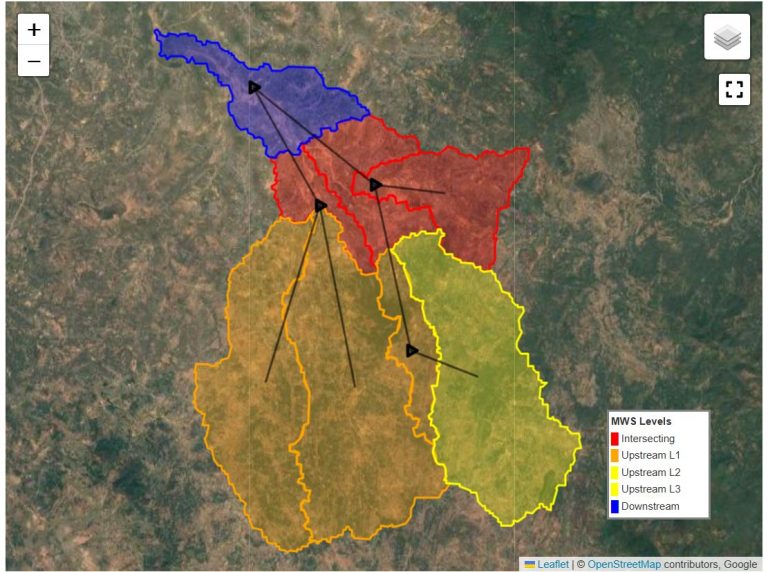
To understand this better, just call some APIs and examine the output. Will give you an immediate sense of what we mean when we say that we essentially represent various landscape entities as discrete spatial units, organizing in nested and connected relationships. This already gives a lot of flexibility to conduct ready analysis like the examples we have given in the main challenge document, and will become more and more powerful when we also add other entities like agroforestry plantations, forest stands, farms, etc.
Also browse the STAC specs and the technical manual to understand the specifics of these properties in more detail.
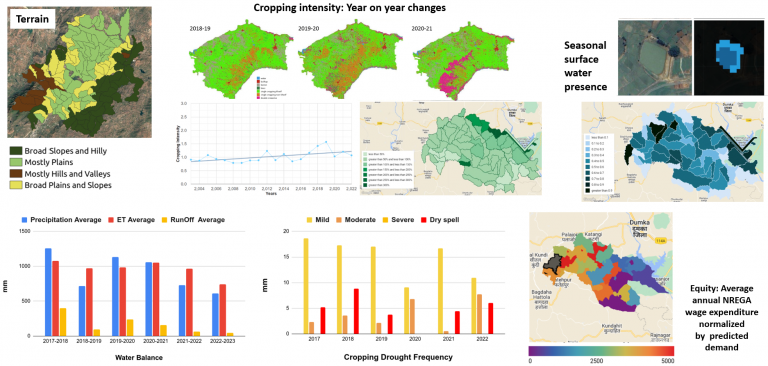
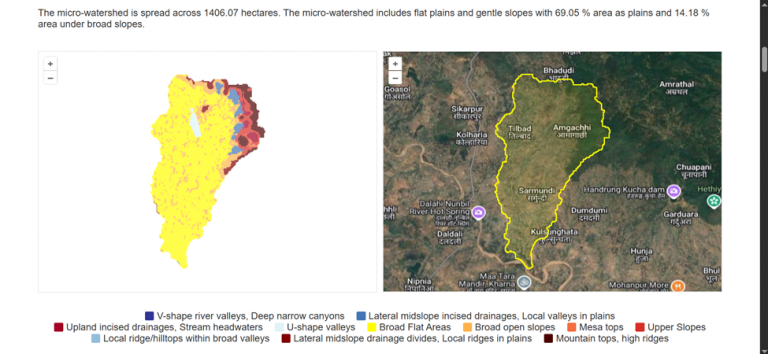
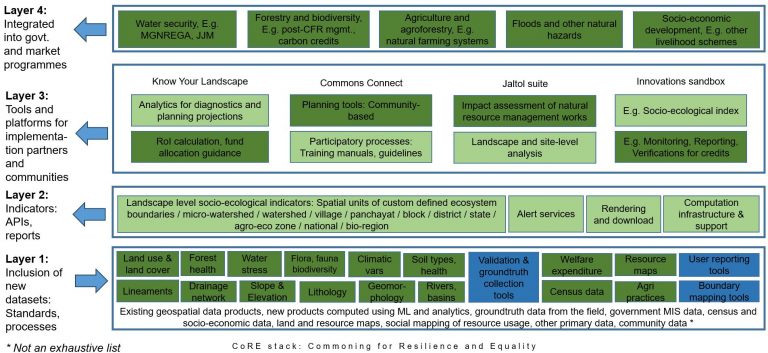
In essence, you will figure out that the nuts and bolts of the whole setup is that we start with rasters, some of which already exist (like DEM, rainfall) and most of which we create ourselves (like terrain classification, LULC classification). Then we run further models and algorithms on these rasters to generate vectorized outputs for micro-watersheds and villages and other spatial units (% area in a micro-watershed under each terrain type, % area under each LULC, drought intensity and frequency, runoff, etc.).
These spatial units of micro-watersheds, villages, etc. can be considered as standard registries, sort of like Aadhaar, with an ID and boundary polygon for each unit. The vectorized outputs from various models and algorithms can therefore be joined with one another to build a super rich set of datapoints for each landscape entity.
Each of these models or algorithms work by producing vector layers populated with properties for various landscape entities. The STAC specs describe these layers. The APIs we have provided essentially collect the properties from multiple layers and return them in one go. The API output can be understood more easily from the ER diagram.
Hope this will make things more clear and we look forward to your ideas for the CoRE stack innovation challenge! You will now be able to understand what the three types of problems we have outlined for data exploration in the main challenge document really mean:
- Boundary flexibility: We have so far computed most properties on micro-watershed boundaries. While this is technically correct for hydrological properties, people often want to understand the same properties on administrative units like villages and panchayats. That’s what the first set of problems are about, to vectorize the underlying rasters and compute properties on village units. You can see from the code how the properties are currently computed on micro-watershed units, and can similarly compute them on watershed units.
- Composition problems: These are about using the existing properties in innovative ways to answer interesting questions.
- Integration of external data: You can pull in more data and relate them with the existing properties to do even richer analysis. A stretch would be to write pipelines that can help incorporate these new properties into the CoRE stack itself! Check this wish list of many key datasets and algorithms we want to bring into the stack.
Note that a lot of information is also available in the pan-India GEE assets which hasn’t been pulled into APIs as yet. So if you can couple GEE processing with the APIs then you can do even more things than with the APIs alone.
Watch this video to also get a better sense of the data organization.
And join the Googlegroup and Discord channel to contribute and to get clarifications, and participate in weekly community calls on Fridays 3-4pm IST.