Authors: Aaditeshwar Seth, Shivani A. Mehta, Riti Verma, Immanuel Shadrach (IIT Delhi), with Cursor Composer Fast and Claude Sonnet
Project: CoRE Insights v0.1 for Landscape Problem Diagnosis
Introduction
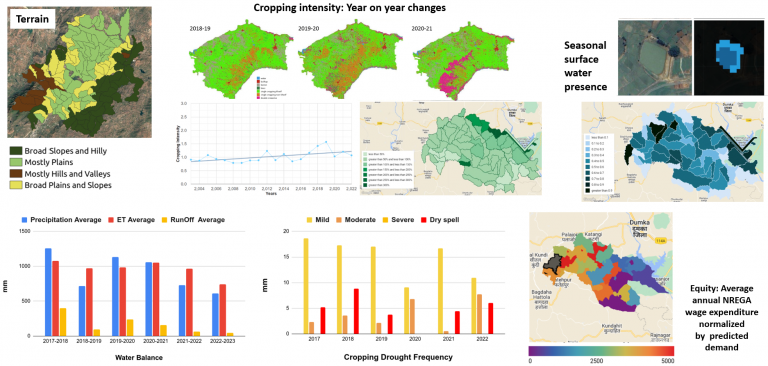
The CoRE Stack assembles an extraordinary volume of geospatial, hydrological, agronomic, and socio-economic data for every micro-watershed (MWS) in India – typically 1,000–1,500 hectares of lived landscape. However, the challenge is in understanding what all this data is telling us: How can a watershed developer or a community landscape steward use this plethora of information to diagnose problems and take action, without going crazy with all this data?
This blog describes how we built a diagnostics engine that turns peer-reviewed knowledge and MWS variables into executable logical expressions – rulesets evaluated deterministically in milliseconds, without requiring a large language model (LLM) at query time. The approach sits in the tradition of neurosymbolic AI: LLMs help extract and draft symbolic rules from literature, given all the knowledge and diversity of scenarios they have seen; humans and scripts curate them; and the runtime executes them reproducibly over real data, reducing hallucination and making reasoning inspectable.
After extensive normalization, review tooling, and threshold tuning using field case studies, our server-only mode (pure rule evaluation) now performs nearly at par with Claude on a structured rubric-based evaluation of multi-system landscape diagnosis, while running in milliseconds and costing nothing per query.
The vision is to embed this engine in community-facing tools, alongside Commons Connect, so that place-based changemakers can diagnose problems, discover solutions, connect with enabler organizations, and take collective action grounded in their own landscape data.
Motivation: Making sense of an MWS
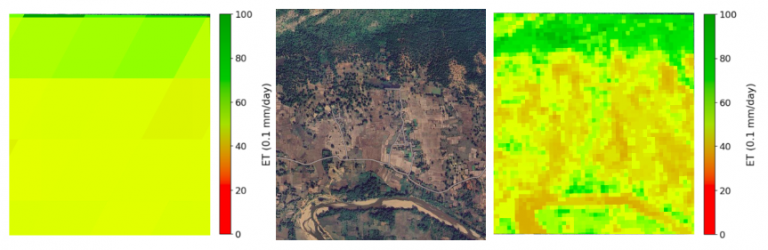
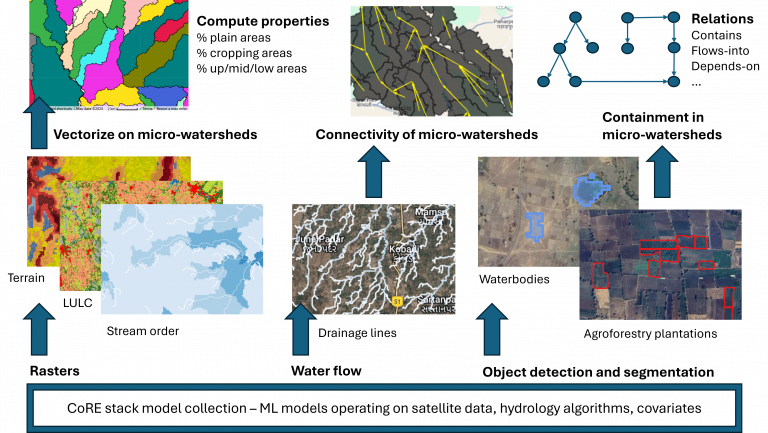
A micro-watershed is the unit at which natural resource management in rural India is often planned and implemented. The CoRE Stack ingests satellite imagery, census and survey statistics, groundwater classifications, land-use trajectories, MGNREGA works, village facilities, and more – over a hundred variables per MWS, each with history and indexed to an MWS.
But for a watershed programme manager, a field extension worker, or a landscape steward, raw data dashboards are not enough, they need to understand what specific problems is this data is pointing towards and the best way to address them:
- Is this village cluster facing groundwater stress or rainfed risk?
- Is forest degradation or grazing encroachment the more plausible story for NTFP decline?
- What solutions fit this aquifer and this terrain?
- And most important, what do we still not know in the data, and what should we ask the community next?
Our goal was a system that could support these questions transparently, where every confirmation could be traced to specific variables and boolean conditions, not buried in persuasive prose.
Methodology: From production systems to fine-tuned expressions
The pipeline has seven stages, with human review loops throughout:
- Identification of production systems: Agriculture, livestock, NTFP/forest biodiversity, socio-economic production, and others. These are the lenses through which rural livelihoods are organised, and were identified through an automated analysis of case studies of interventions undertaken by prominent Civil Society Organizations (CSOs) in India.
- Literature retrieval: For each production system, we identified relevant peer-reviewed and grey literature on stresses, causal mechanisms, and interventions in Indian landscapes.
- Paper curation: Over 200 retrieved papers were screened and chunked for citation-backed ruleset generation.
- Data dictionary: We catalogued every variable available in the CoRE stack per MWS: hydrology, LULC, drought indices, aquifer class, MGNREGA, village demographics, and various derived quantities such as mean, max, min, etc.
- Evidence card generation: Based on the curated set of research papers and variable listing, Claude drafted evidence cards: structured JSON per causal pathway and social-ecological context cluster (aquifer × agro-ecological region), each containing diagnostic signals, confirmation policy, prose explanations, and most importantly, follow-up questions for variables that the data dictionary lacked.
- Normalization and alignment: A large engineering effort followed, sustained only through the pure grit that coders possess 🙂
- Alignment of hallucinated modifications and made up variable names to the data dictionary
- Correction of malformed signal expressions in Python to make them evaluable against real MWS data
- Confirmation policies reconciled with LLM prose (so the rules match the stated reasoning)
- Prose then revised again to match final policies and expressions after further removal of duplicates and logical flaws
- Optional automated fine-tuning: Thresholds in expressions adjusted against labelled case-study MWSes using an empirical grid-search algorithm.
This is, in essence, knowledge compilation: neural generation → symbolic artifact → deterministic execution.
How we built the framework: Case studies → Production systems → Pathways
We did not start with a textbook taxonomy. We first mined the web and found nearly 300 case studies and field reports from CSOs working on natural resource management in India — including FES, WASSAN, PRADAN, WOTR, and others. These narratives were pushed through LLMs and manually curated to:
- Group projects into production systems (agriculture, livestock, forestry, NTFP, socio-economic, …)
- Extract observed stresses (what people said was going wrong)
- Propose causal pathways (mechanistic hypotheses linking data to the stress)
Eight causal pathways have full evidence-card coverage today (highlighted in green in the figure):
| Production system | Observed stress | Built pathways |
|---|---|---|
| Agriculture | water_scarcity | drought, groundwater_stress, rainfed_risk, irrigation_challenges |
| NTFP / forest biodiversity | ntfp_decline | forest_degradation, encroachment |
| Socio-economic | economic_hardship | multi_sector_vulnerability |
| Socio-economic | low_income | small_landholding |
32 curated case studies for which we could precisely identify the location also serve as ground truth for automated signal tuning.
What a pathway looks like in practice
A pathway is basically a small expert system scoped contextually to each socio-ecological context cluster.
Example (simplified): Agriculture → water_scarcity → groundwater_stress
| Component | Role |
|---|---|
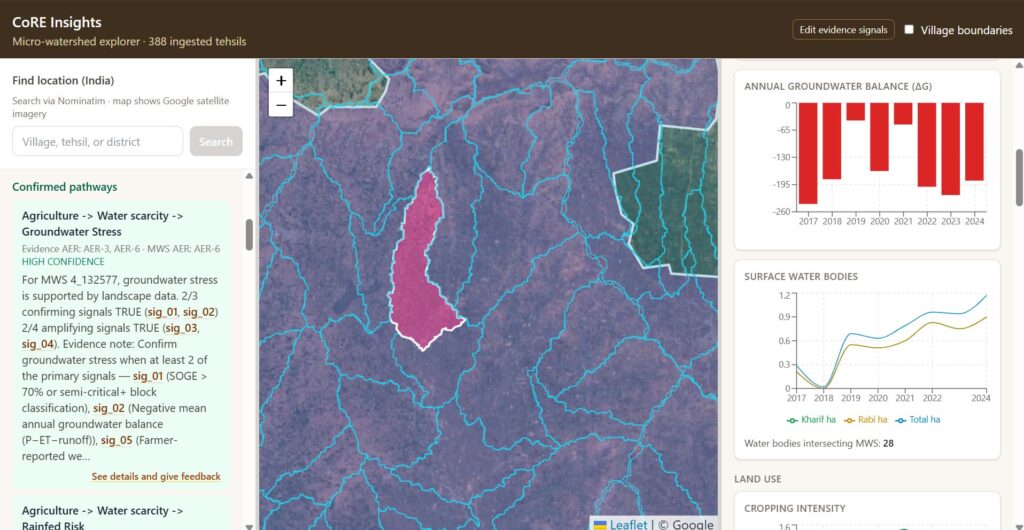
| Signals | Boolean expressions over MWS variables, e.g. soge_dev_percent > 70, mean_annual_delta_g_mm < 0 |
| Direction | confirms or amplifies – only confirms (and policy-approved follow-ups) can confirm a pathway |
| Confirmation policy | e.g. “confirm when ≥2 of signals are true; amplifiers alone do not confirm” |
| Follow-up questions | MCQs for variables not in the database (well depth trend, borewell density), answers to which can flip signals |
| Prose | Citations and explanations for humans, must stay consistent with the executable rules |
At runtime the engine loads cards matched to the MWS, evaluates every active signal against the variable bundle, applies the confirmation policy, and returns confirmed/uncertain pathways, solutions, and the highest-priority follow-up question, all without an LLM.
The pivot: From “Claude diagnoses everything” to LLM-in-the-loop
This was not the original plan though.
We began by asking Claude Sonnet and Qwen (via a local Ollama instance running on a GPU workstation) to read the full variable bundle and write diagnostic prose directly. Claude was almost always brilliant – rich, context-aware, citation-flavoured reasoning. Ollama was less coherent. But both paths had problems:
- Hallucinated variable names not present in the data dictionary
- Broken arithmentic which still somehow led to the right result
- Persuasive but opaque prose making it hard to see how a conclusion followed, or to compare reasoning across queries
- Cost and latency, roughly ₹10 per Claude query, with each Claude or Ollama query taking 60 seconds on average to complete
- Non-reproducibility: same MWS, different runs, different emphasis
Meanwhile, as we improved signal expressions, we realized that the signal logic was much easier to follow than the LLM explanations. A programme manager could read mean_annual_delta_g_mm < 0 and agree or disagree.
So we took a major branch: llm-in-loop. In this, the server is the primary responder; LLMs are optional reviewers (want_llm_opinion=true) that comment on the same variable bundle and pathway set. We as humans therefore stay in charge, checking whether our compiled rules need improvement, not outsourcing judgment to AI.
The hardest part: Persistence
But this pivot to doing signals expressions on our own with no expectations of help or corrections from LLMs meant that we were on our own and had to get these expressions right. We had committed ourselves to this direction, much like how in rock climbing and trekking we commit ourselves to a route and there is then no looking back. We ended up building a whole suite of test cases and correction scripts and user interfaces to help us in this process. Right from ensuring that all variables in the data dictionary were available throughout the stack, to the confirmation policy making use of all relevant variables, being in agreement with the prose that had been originally provided by Claude, and getting Claude to again review the expressions we had rewritten, we spent hours and late nights getting this right. In hindsight, had we used some agentic loop to do this it might have saved us some time – see notes for suggested re-build in the future.
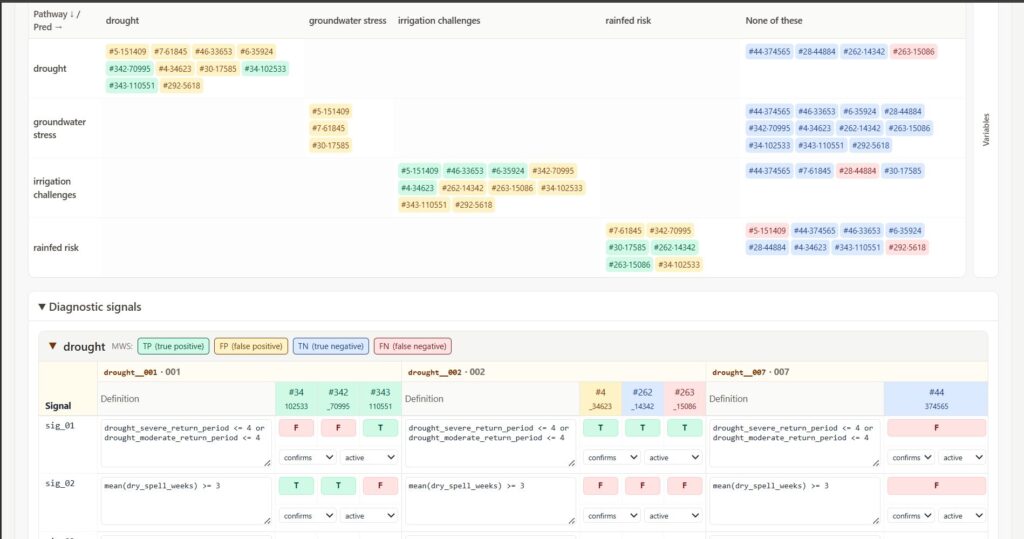
A cool thing we built in this process is a triaging interface that lets us rewrite expressions and tweak thresholds on the fly, and see if we are able to improve the confusion matrix.
Evaluation: Rubric, modes, and results
We finally asked Claude to help design an evaluation rubric and an automated evaluator LLM then scores each diagnosis on six dimensions (scores 0–3 each):
| ID | Dimension | Weight |
|---|---|---|
| D1 | Query relevance | 20% |
| D2 | Variable grounding (available data cited with values) | 25% |
| D3 | Reasoning correctness (direction of inference) | 25% |
| D4 | Appropriate uncertainty | 10% |
| D5 | Follow-up question quality | 10% |
| D6 | Solution relevance & actionability | 10% |
Error flags (EF1–EF5) penalize variable hallucination, wrong inference direction, confirmed pathways with no data support, and follow-ups about already-available variables.
The results when evaluated 28 case-study instances to answer a generic query for full landscape diagnosis sets up the server-only mode at par with Claude.
| Mode | Mean weighted score | Std dev | Notes |
|---|---|---|---|
| Server-only (expressions) | 82.8% | 13.4% | Milliseconds; no LLM |
| Claude (LLM reviewer) | 86.0% | 10.2% | ~60 seconds; API cost |
| Ollama independent (scores to be updated) | 44.5% | 10.4% | Superseded; not recommended as primary |
| Server + Ollama review (scores to be updated) | 66.2% | 16.1% | Legacy dual-opinion mode |
Server and Claude are now within ~3 percentage points on this benchmark. The symbolic path achieves comparable quality at a fraction of cost and latency.
Limitation: We need to move to a different Judge LLM. And we need more groundtruth data so as to be able to create a hold-out set. The evaluation is methodologically weak right now.
Vision: Stewards, Commons Connect, and collective action
While the current interface is desktop based, the actual engine is meant to live inside community-facing workflows and not as a researcher-only console.
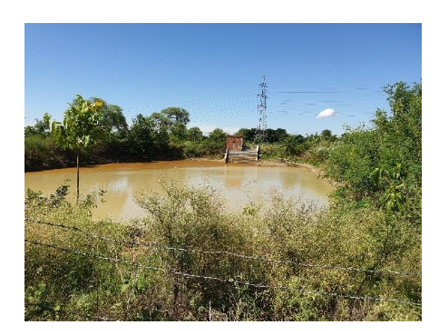
Commons Connect is the CoRE Stack application already used by hundreds of landscape stewards (~500 in active NRM planning workflows) to build participatory natural resource management plans with communities. Field stories from PRADAN, FES, and partners describe data-backed plans taken to government departments for funding, including farm ponds and check dams for drought protection, agroforestry on fallow lands, waterbody rejuvenation, cow sheds and goat sheds for livelihood resilience.
The next step is to embed the conversational diagnosis panel (and its evidence-backed info panel) into a chatbot interface on Commons Connect or an accompanying chatbot, with local-language translation and plain-language prose, so changemakers in a place, the true owners of that place, can:
- Diagnose what production-system stresses the data supports
- Discover context-appropriate solutions already encoded in evidence cards
- Connect to a broader working group of enabler CSOs and mentors in their geography
- Collectivise and take action
This aligns with the place lens of place-based, owner-led change with responsive infrastructure, articulated brilliantly by Rainmatter Foundation, and with community-based technology management and ownership demonstrated at scale by Gram Vaani, of technology as enabler of voice and deliberation.
What comes next: Ground truth from stewards + signal fine-tuning
With Commons Connect stewards, we now plan to collect richer ground truth: which causal pathways they confirm in their MWS, which signals fire correctly, and where thresholds need local adjustment. That feeds an automated fine-tuning algorithm we have implemented:
- Stewards label their MWSes as positive/negative for each pathway section.
- Pool variables using local knowledge, not available in the data dictionary as yet.
- The algorithm searches thresholds on empirical midpoints between observed values to maximise true-positive rate while controlling false positives.
- Write patches to for review in the triaging app with confusion matrices for quick assessment.
Human approval remains mandatory at each step.
Reflections
In neurosymbolic terms, we used the LLM as a neural front-end to literature and variable semantics, then compiled its outputs into a symbolic layer (expressions + policies) executed by a deterministic engine. Hallucinations thus get ruled out when the runtime can only cite dictionary variables and evaluate parseable boolean logic. The comparison with Claude is striking: we may have approximated, through curation, the decision boundaries the LLM would have inferred, without having to pay the inference cost each time.
Keeping LLMs in the loop but not in charge feels like the right approach for rural NRM: agency stays with stewards and enablers; models advise when asked.
Most interestingly, we did not write a single line of application code in the conventional sense. Working through Cursor and Claude to debug mismatched variable names, confirmation policies that misfired, cluster retrieval edge cases, stale triage patches, felt uncannily like the debugging we have done our whole career to uncover what was going wrong under the hood. Only the layer changed: not “why did this pointer go out of bounds” but “why does this signal still not fire“.
Further improvements needed
The current stack is a working research prototype that has perhaps reached piloting maturity but needs a lot more testing before letting it loose. Several directions would materially strengthen it.
A cleaner rebuild from scratch: Much of the codebase reflects incremental learning on the way: dual LLM modes that are no longer required, uneven handling of patch formats, aquifer vocabularies that had to be reconciled across four naming schemes, and evaluation tools layered onto an API that grew feature by feature. Most importantly, the use of tighter prompts to reduce hallucinations and to use agentic loops to correct and refine the signal expressions and confirmation policies so that we get syntactically correct and internally consistent outputs, which will reduce human curation effort. Substantial simplification is possible if we were to rebuild with today’s settled design. A greenfield version would be smaller, faster to onboard new contributors, and easier to embed in Commons Connect.
Systems thinking (mixed pathway signatures): Today each pathway is largely diagnosed in isolation. The next leap is to read patterns across confirmed and absent pathways on the same MWS:
| Pattern | Possible systems reading |
|---|---|
| Groundwater stress confirmed, rainfed risk not | Irrigation demand may dominate extraction and recharge imbalance rather than rainfall deficit alone; intervention bias toward demand management and recharge, not only drought contingency. |
| Deforestation / encroachment confirmed alongside groundwater stress | Hillside forest loss may be drying streams and reducing baseflow – a land–water coupling story; solutions may need to pair catchment greening with groundwater governance, not treat aquifers in isolation. |
| Multiple socio-economic pathways with weak hydrological signals | Livelihood stress may be the dominant system in that cluster; hydrological works alone may be insufficient. |
Encoding these cross-pathway rules – which combinations imply which dominant operating system, and which solution bundles follow – would move the engine from per-pathway expert systems toward landscape-level systems diagnosis, still grounded in explicit logic rather than opaque LLM synthesis.
Remaining pathways and new variables: Eight causal pathways have rulesets today; the framework defines many more (livestock, forestry, additional agriculture and NTFP stresses) that still lack compiled expressions. Building them out requires the same paper → rulesets → normalize → tune loop, with case-study ground truth for each new section.
Equally important is ingestion of new data variables, especially for:
- Grasslands and pasture health: fodder availability, grazing pressure, rangeland degradation (critical for livestock production systems barely represented so far)
- Forest biodiversity: composition and integrity beyond LULC area counts; NTFP potential depends on species mix and forest condition, not forest polygon hectares alone
These variables would unlock pathways for pasture degradation, fodder shortage, and finer-grained NTFP decline mechanisms that the current dictionary cannot yet support.
Beyond the micro-watershed: Other entity types: The MWS (~1,000–1,500 ha) is the right unit for NRM planning, but stewards also reason about finer and coarser entities:
| Entity type | Example questions |
|---|---|
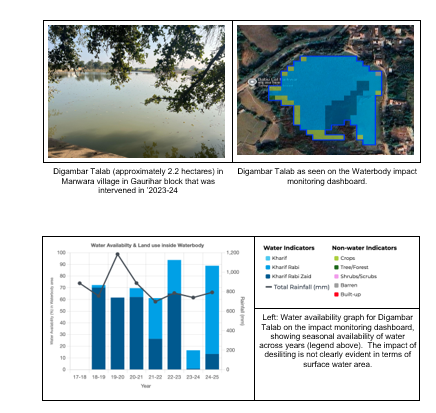
| Waterbodies | Is this tank silting? Is catchment degradation reducing inflow? Is encroachment shrinking water spread? |
| Farms / field parcels | Which plots are irrigated vs rainfed? Where is soil moisture stress acute within the MWS? |
| Forest stands | Which patches are degrading vs recovering? Where is NTFP collection pressure highest? |
Extending the same rulesets + signal-expression pattern to these entity types, with entity-scoped variable bundles and retrieval keyed to aquifer, slope, or land tenure, would let the diagnostics engine meet users where they already think, not only at the MWS aggregate. Technically this implies nested or linked diagnoses: MWS-level landscape scan plus drill-down cards per pond, farm, or forest patch, all sharing the same neurosymbolic discipline. The good thing is that the CoRE data structure supports exactly this flexibility. So much more to do, and the way forward seems clear – just needs doing.
Check out CoRE insights now and send us your feedback! Github repo.