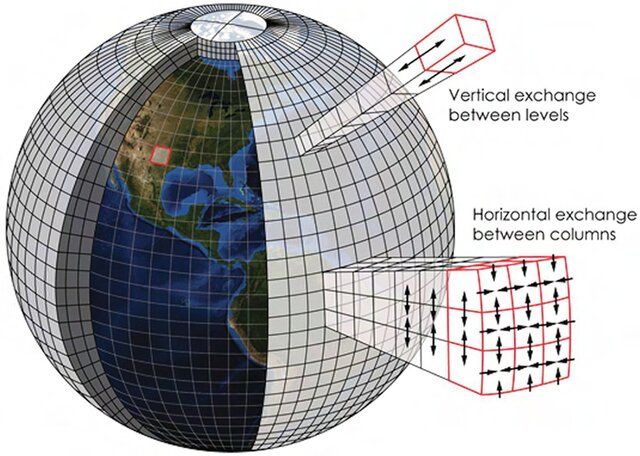
Climate scientists recognized a while back about the importance of coming up with a standardized Earth System grid. Today most scientists do experiments on a standardized grid that makes it possible to exchange data and results across a global network of 10s of thousands of scientists collaborating on initiatives like CMIP where land, atmosphere, ocean, and other models are coupled together to more and more realistically simulate the climate of the Earth.
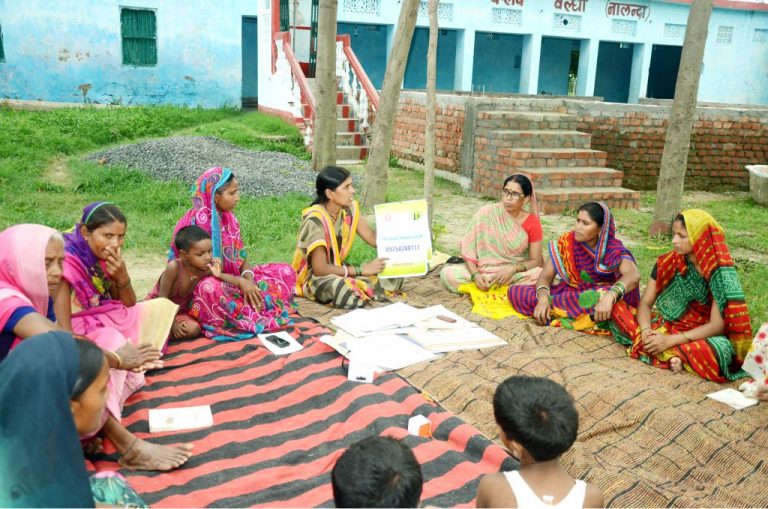
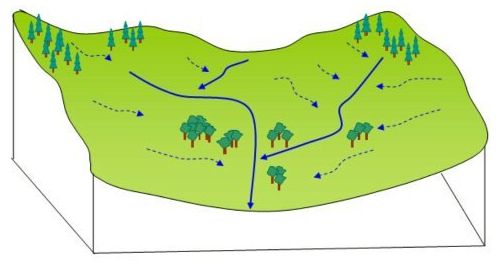
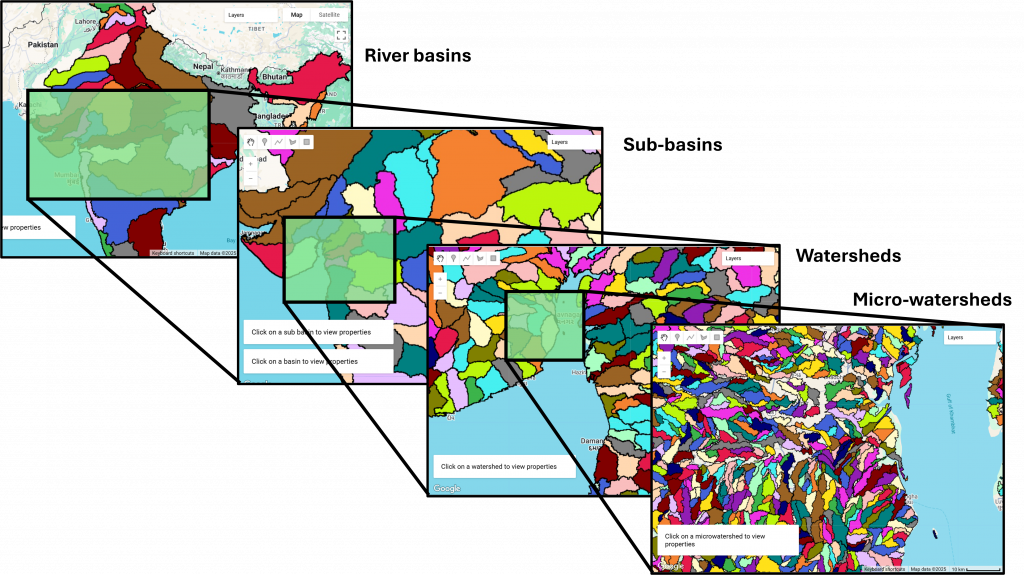
Coming down to local scales, for rural communities to plan and manage their commons and natural resources, where especially water security is a key issue getting exacerbated by climate change, a similar approach can enable data sharing between researchers, implementation organizations, and communities. Planning for water requires us to operate in hydrology units called watersheds. A watershed is a delineated boundary on the land surface defined to capture water flow. Think of it as a demarcation that has one outlet for surface water flow into a downstream watershed, and can have multiple inlets for water flow from upstream watersheds. This way, a watershed becomes like a self-contained unit in which rainfall collects, gets used locally, and runoff drains into a network of drainage channels. These drainage channels are nothing else but nalas, creeks, streams, and rivers, which connect different watersheds together. Things are a bit more complicated of course because this delineation does not model groundwater flow which can follow its own contours, and which unfortunately are not mapped very well, but at least surface water flow can be modeled reasonably well using this setup.
Like climate scientists, hydrologists too have come up with global watershed delineations that enable them to index their data and results on a common structure. Most such delineations, like the Hydrosheds project, are very large though, of watersheds of 10s of thousands of km2 extent. These units are too large for local community-based planning which happens at village or panchayat scales. Integrated watershed management projects done by the government also use smaller watershed units. However, these boundaries are not publicly available.
We have therefore built a pan-India micro-watershed registry by algorithmically delineating the land surface into units of about 1000ha each. The boundary assets are available on our pan-India assets on Google Earth Engine.
To see the benefit of this approach, check out the Know Your Landscape dashboard. We index all our data to standardized micro-watershed units which enables us to describe these units in terms of all sorts of variables – their terrain, land-use, changes over time, rainfall, runoff, water balance, etc. And further, we list out waterbodies in these micro-watershed units, farms, plantations, etc., which helps us represent landscapes in a neat data structure which we can use for all sorts of analysis and computations.
Step 1: Delineation
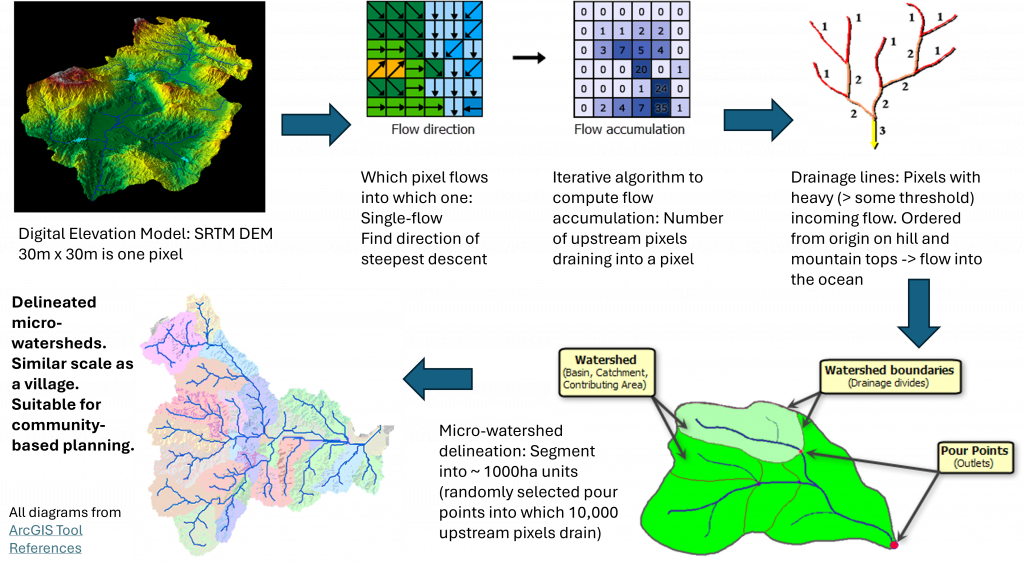
We start with river-basins, sub-basins, and watersheds already delineated by the Government of India. And segment them further into micro-watershed units.
The delineation has been done algorithmically using GDAL and other libraries for geospatial data processing. This step-by-step process outlines the methodology. Do note that the delineation is not unique, so this is a micro-watershed registry – anyone can come up with their own, but of course having one registry that everyone agrees to will make it possible to index all data to this registry and make collation easier.
Step 2: Populate data-points
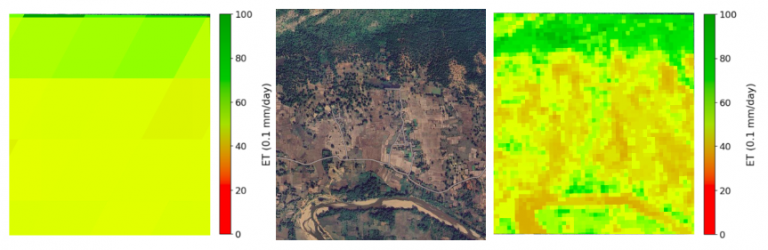
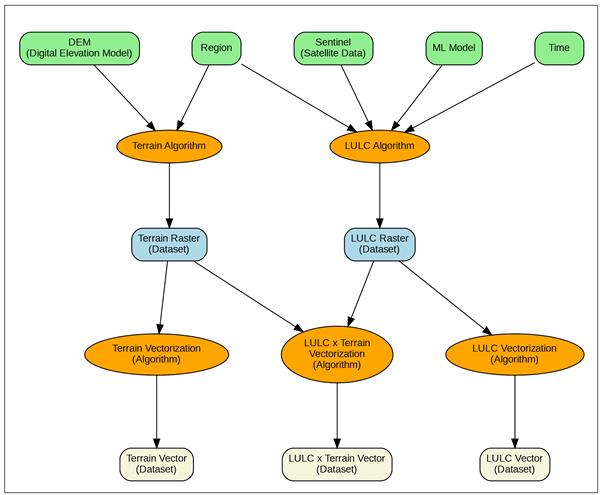
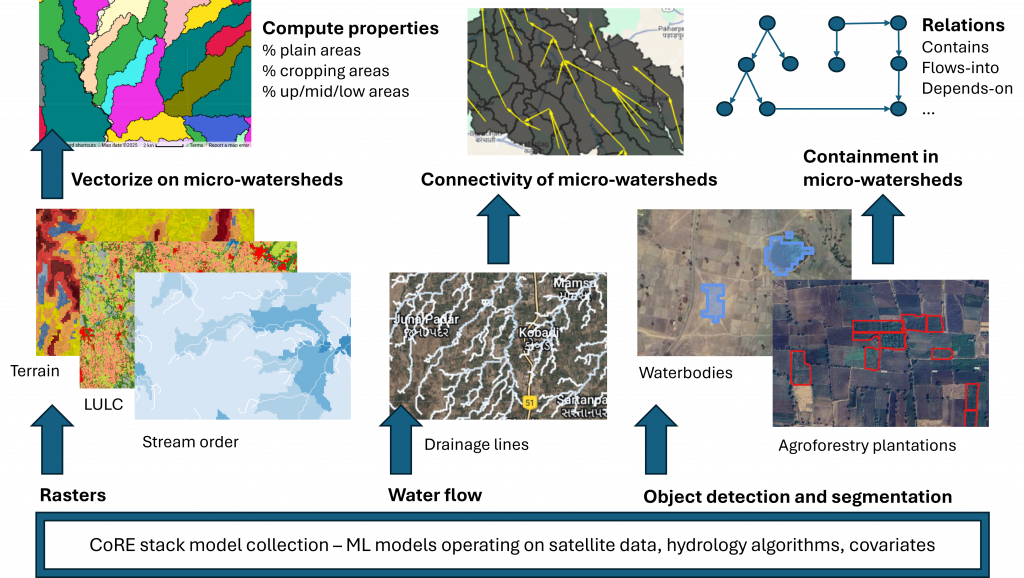
We then use the large set of CoRE stack geospatial models which generate rasters of terrain, land-use, etc. and vectorize them to on the micro-watershed boundaries. We can thus describe each micro-watershed in terms of its terrain (% area under plains, % area in valleys, % area on flat mountain tops…), land-use (% area with tree cover, % area cropped in Kharif, % area cropping in Rabi… over the years), stream order (% area on up-land, mid-land, low-land), etc. Similarly, we use the drainage channel network to build a connectivity graph of micro-watersheds. And we use farm ponds, wells, plantations, etc. identified through object detection methods on hi-res satellite imagery, to list out these entities within micro-watersheds. Most underlying layers are available pan-India whereas the micro-watershed indexed data is available for several tehsils, and which we will expand to a pan-India scale.
Step 3: Data representation
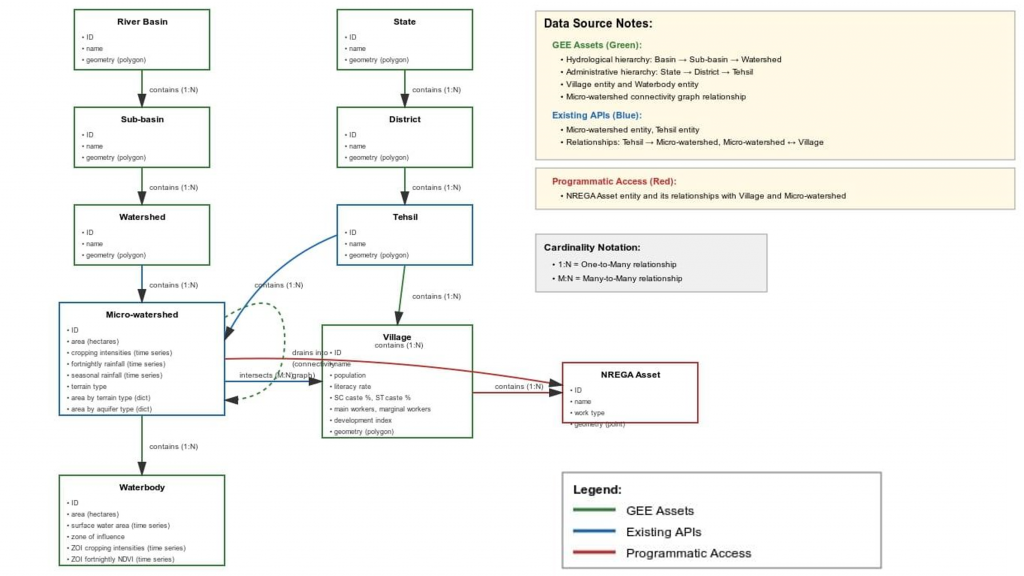
All this data can be encapsulated in a data structure that represents landscapes in terms of discrete entities organized in a hierarchical setup (E.g. river basins -> sub-basins -> watersheds -> micro-watersheds -> waterbodies), and with connections to one another (E.g. [upstream micro-watersheds] drain into a downstream micro-watershed, farm depends on waterbody, etc).
Step 4: Dashboards and analysis
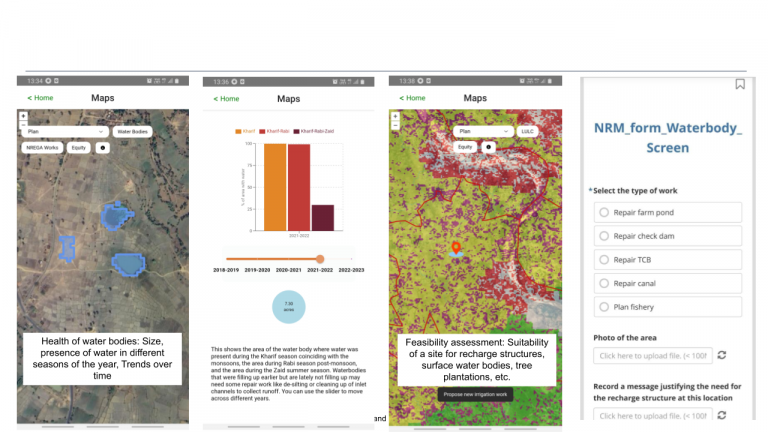
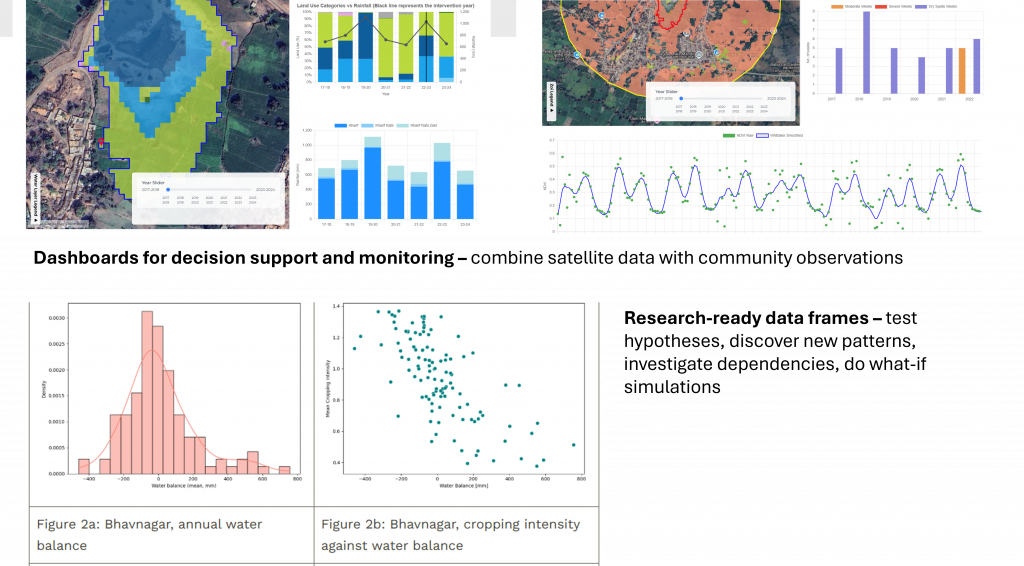
Finally, the data can be neatly presented in dashboards for landscape planning and monitoring, and for community-facing apps for rural communities to plan for the sustainability and resilience of their landscapes. Check out Know Your Landscape (which now has a new feature to view waterbody details), a waterbody tracking dashboard, agroforestry tracking dashboard, and of course the Commons Connect application for bottom-up planning. Also see the CoRE stack analysis starter kit and APIs to access the data easily for research purposes and the CoRE stack innovation challenge.
Limitations and further thoughts
These are pre-delineated micro-watershed boundaries and ready for indexing of any geospatial data. This can make data sharing and collaboration easier.
Using hydrology units like these for water security planning and monitoring is technically also a correct way to do watershed planning than to do it on administrative boundaries.
The boundaries are static since they are derived from Digital Elevation Models of the Earth’s surface which does not change drastically over time, unlike village boundaries which change every now and then, and are also not easily available.
Further, doing this algorithmically makes it possible to replicate the setup for anywhere globally – we are envisioning a federated CoRE stack network of multiple instances, let’s say one in each country, which generate and manage their own data using locally adapted models.
However, some practical and technical limitations do remain:
- The delineation available in the v2 boundaries was done on the SRTM DEM. Newer DEMs like FABDEM are more accurate and a new v3 can be produced at some point. Likewise, SRTM and FABDEM have a resolution of 30m. Better resolution DEMs at 10m or more are likely to come soon.
- For planning and implementation purposes, fund administration is still done at the village and panchayat level though, which means that micro-watersheds need to be intersected with administrative boundaries and consensus is needed to plan jointly rather than in each administrative unit independently.
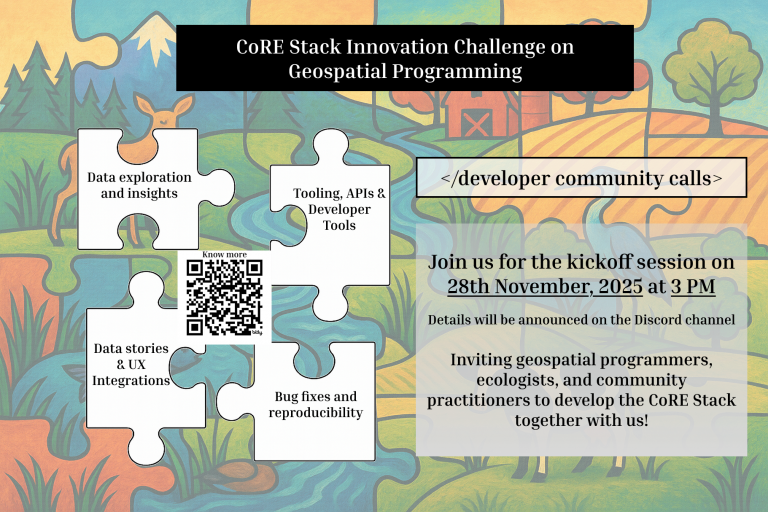
Partly to help handle these limitations, and to enrich the CoRE stack with adding new datasets and pipelines, and think of new use-cases and analyses, we have launched the CoRE stack innovation challenge. Do participate and build upon these innovations. Join the CoRE stack developer community Googlegroup and Discord channel. Community calls are happening each Friday from 3-4pm. Videos from previous meetings are available on the innovation challenge page and Youtube channel.