Landscapes change in response to nature and human activities. Land use and land cover (LULC) classification is required for land management and planning models, and is increasingly done through remote sensing data. We propose an open-source methodology to capture these changes on an annual basis to mine valuable insights that can prepare the community towards sustainability.
Read more about our work on this blog.
Requirements
To perform LULC classification using our proposed system, you would require the following-
- Google Earth Engine Account: All the scripts can run through an authenticated Google Earth Engine Account. You can use this link for registration.
Classification Methodology
We follow a hierarchical classification approach to cover a broad variety of LULC classes.

Level-1 Classification
We begin with 4 high-level classes-
- Greenery: These are vegetative patches of land like croplands, grass, forests, and alike.
- Water Bodies: These cover both seasonal and perennial water bodies.
- Built-up: These are man-made constructions on the Earth’s surface that includes roads, builtings, etc.
- Barren land: These are non-vegetative patches of rocky, watelands, and barren areas
We refer the IndiaSAT paper to produce this classification using Sentinel-2 multi-spectral data as input to a ran-dom forest classifier. We also use Dynamic World’s output and aggregate their classes into these 4 categories. Then, using a rule-based method, we combine the outputs of both IndiaSAT and Dynamic World to create the final classification at this level. These rules take into account manual visualizations of results to identify strengths and weakness of both the classifiers (IndiaSAT being a per-pixel classifier and Dynamic World being an object-based classifier)
Level-2 Classification
We break the classes at level-1 into sub-classes and use suitable classification methods to do so.
- Cropland: These are farm lands that are cultivated in any given year.
- Forest: These includes trees and forests patches.
- Seasonal Water Body: These water bodies hold water for less than three agricultural seasons in a year.
- Perennial Water Body: These water bodies hold water for all than three agricultural seasons in a year.
To perform cropland and forest classification, we use Sentinel-1 SAR data time series to perform this classification. The training data at this level is partly taken from the IndiaSAT groundtruth used in level-1 and is partly marked manually through visualization on Google Earth Pro. It is ensured that the groundtruth for both categories is geographically well distributed across different agro-climatic zones in India. We use a random forest classifier with 100 trees as the classification model that takes as input an annual 16-day time series of VV and VH bands from Sentinel-1. We further use Slope information from SRTM DEM and use a threshold of 30 degrees to correct misclassifications in croplands, if any.
To perform classification on the seasonality of water bodies, we use a combination of SAR data and Dynamic World’s water output. We use threshold over VV-band of Sentinel-1 to identify water presence in the monsoon agricultural season. This is done to navigate the absence of optical data in rainy incidences. Next, we use Dynamic World’s water output to identify water presence in post-monsoon and pre-monsoon agricultural seasons. These predictions are followed by a rule-based error correction layer on derived optical bands- NDWI followed by NDVI.
Level-3 Classification
Next we break the cropland class, based on their cropping frequency in a year, into the following sub-classes-
- Single Kharif: Agricultural lands cultivated once in monsoon period.
- Single Non-Kharif: Agricultural lands cultivated once in non-monsoon period.
- Double: Agricultural lands cultivated twice in a year.
- Triple: Agricultural lands cultivated thrice in a year.
To perform this classification, we did not have access to any training data. So, we used unsupervised classification using K-nearest neighbour algorithm. We randomly sampled cropland pixels from all agro-climatic regions in India (marked from the cropland groundtruth at level-2). The feature vector for this classification is a 16-day NDVI time series that is derived from a combination of Landsat-7, Landsat-8, Sentinel-2, and MODIS data. This time series is generated on the lines of GCI-30 paper. We do not perform Whittaker smoothing to avoid missing out important peaks in the time series. Initially we created 16 clusters using KNN method and then hierarchically split them into 2 whenever the distortion exceeded the threshold of 0.23. We manually labeled each cluster by interpreting the spread of time series that belonged to that cluster. These clusters are then used to assign the classification label based on euclidean distances to their centroids. The centroids are uploaded as asset on Google Earth Engine and can be accessed with the asset ID- ”projects/ee-indiasat/assets/L3 LULC Clusters/Non Padded Original Clusters WithLabels”. The figure below is a demo of how the NDVI time series can be used to interpret the cropping frequency of a given agricultural land. On the left is the time series on a single-kharif land and on the right is the time series of a double cropped land.

Final Classification Labels
At the end of the complete LULC pipeline, we deliver the following classes with their corresponding value in the raster output.
0:Background,
1: Built up
2: Kharif water
3: Kharif and rabi water
4: Kharif and rabi and zaid water
5: Crops
6: Trees
7: Barren land
8: Single Kharif Cropping
9: Single Non-Kharif Cropping
10: Double Cropping
11: Triple/Annual/Perennial Cropping
12: Shrubs and Scrubs
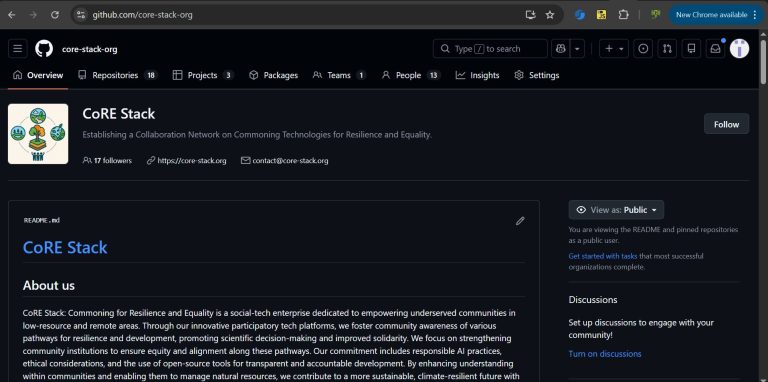
To access the classification scripts, check our Github repository.
Data Collection Process
While a machine learning-based classified land use map is as good as the training data, it is necessary to establish accuracy using validation data’. We verify the cropping patterns by corroborating findings with ground truth data. We can source the data from high resolution satellite imagery and open-source information through Google Earth and Open Street Maps. However, there are limitations to seasonal observations such as, in this case, changing crop type.
IndiaSAT sought to verify the cropping patterns for Raichur district. Challenged by scarcity in secondary datasets, gathering field information was the best alternative. WELL Labs spearheaded the process of data collection with Prarambha, a CSO that works to restoring degraded agricultural land, as round-1
Enumerators were trained to collect information from farmers on the annual crops grown between 2021 and 2023, along with their sowing and harvesting dates. This was performed using the QField app that operates both offline and online, and directs the data to a server. Gram Vaani helped with the technology infrastructure to set up the data collection process, and subsequent cleaning of the data. We determined that information from a total of 251 fields in Raichur district was useful and completed it in the months of April and May 2023.

The first round of data collection gave us important insights about the relevance of collecting diverse data (geographically as well as class-wise) in a scalable manner. The moderation process also brought to light the following mistakes that can be a part of data-collection infrastructure-
- Inconsistent sowing and harvest dates
- Covering multiple farmlands within a single polygon
- Relying on farmers’ memory recall isn’t foolproof as it can lead to recording partial information.
- Difficult validation of the input data with just timeseries visualization
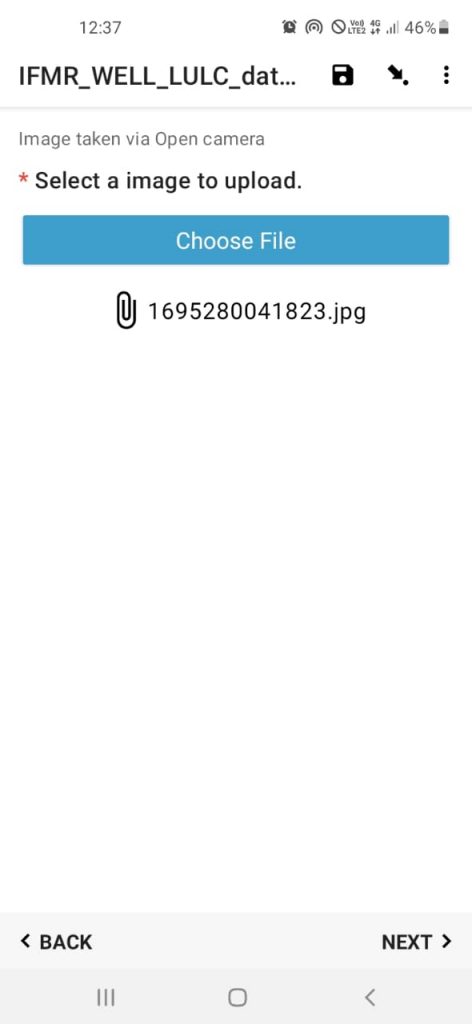
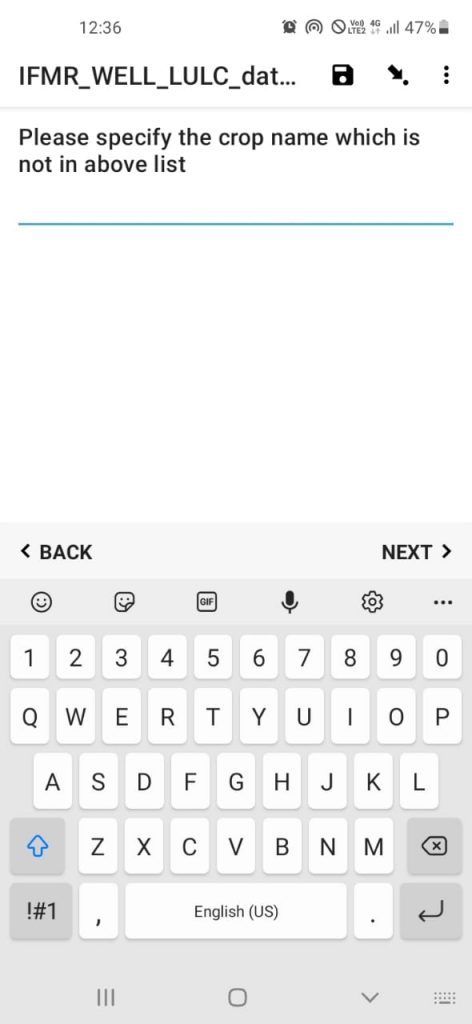
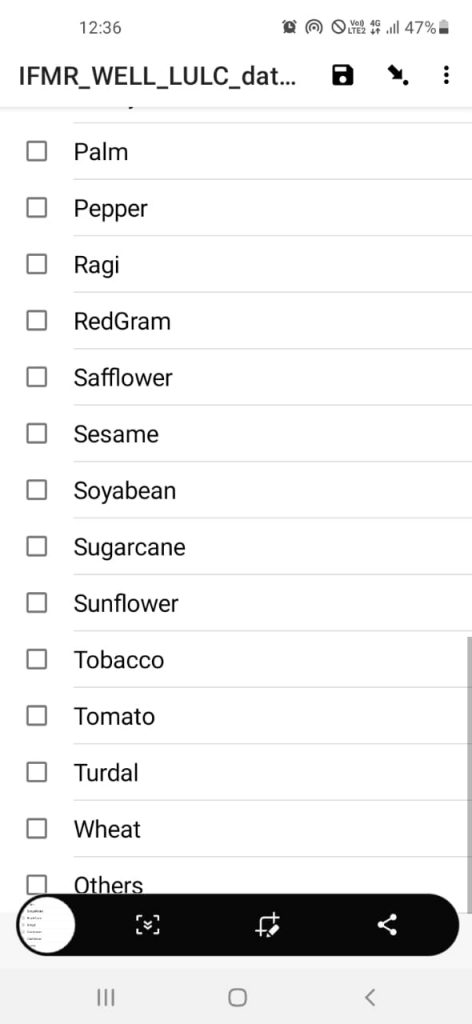
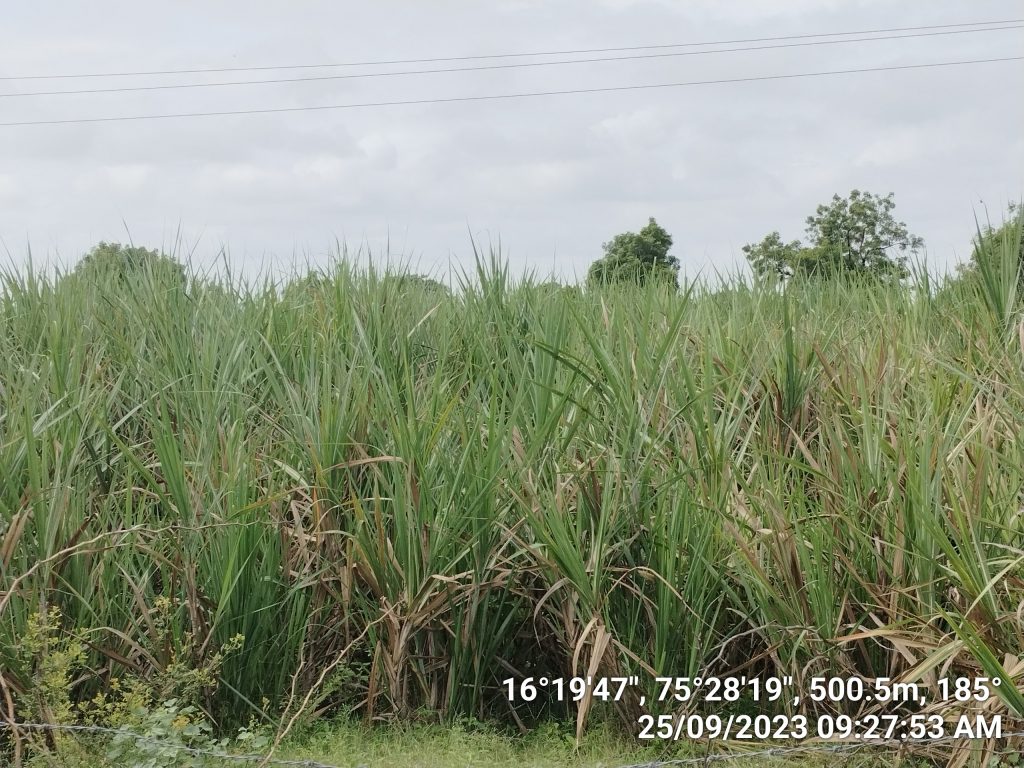
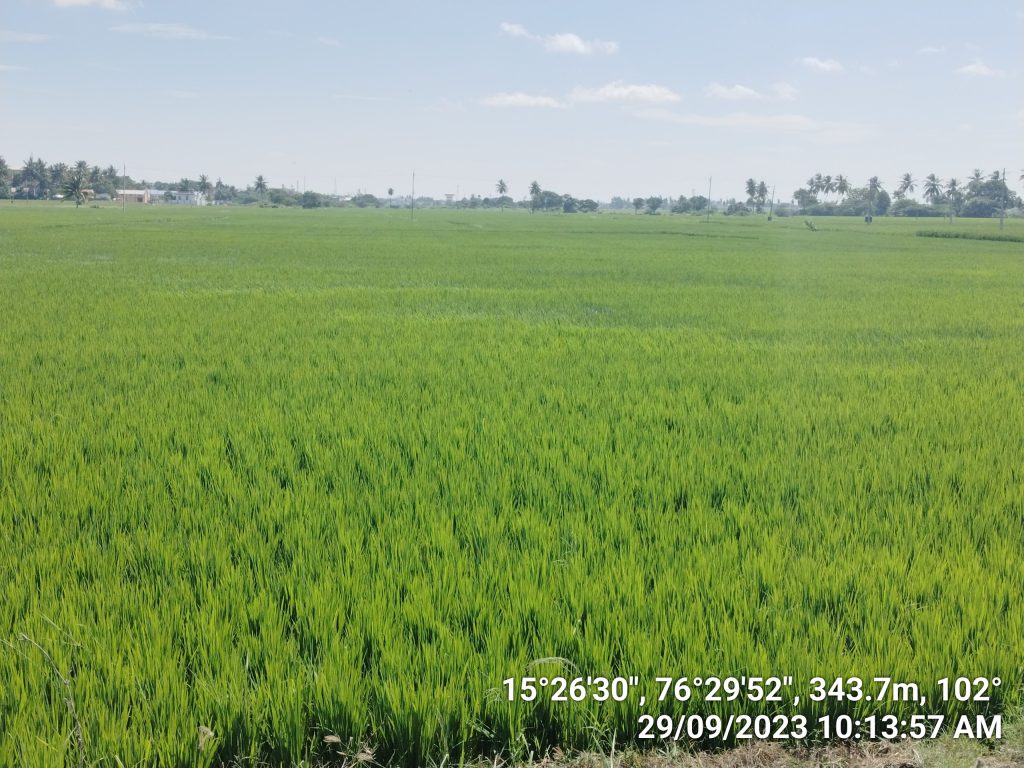
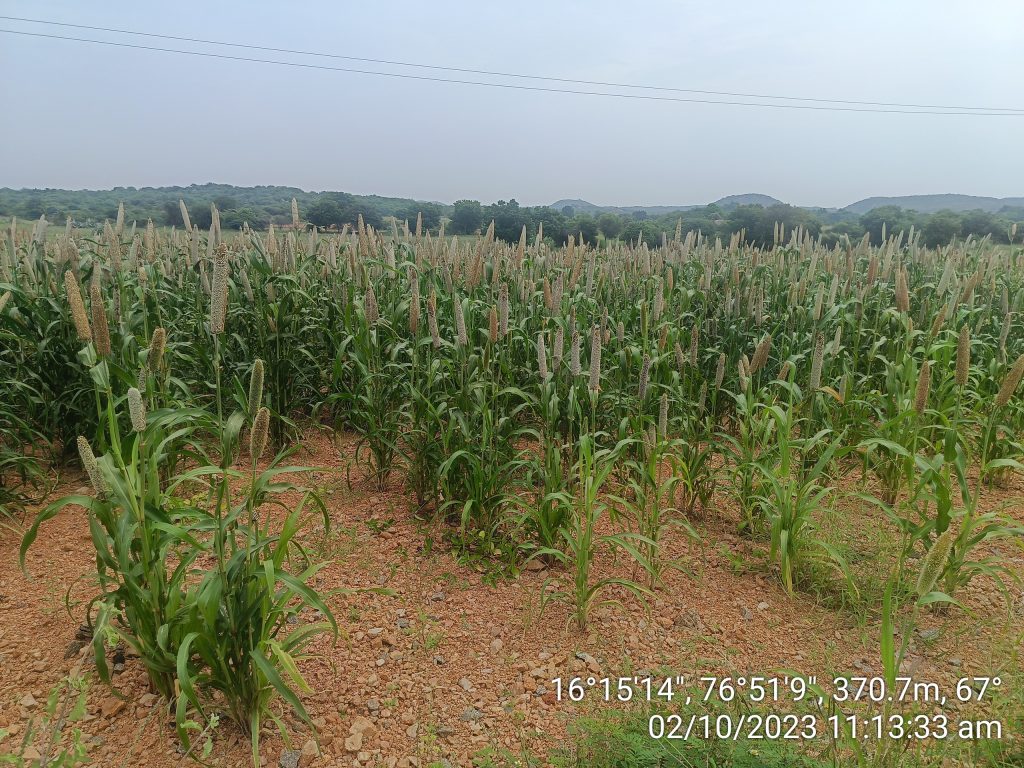
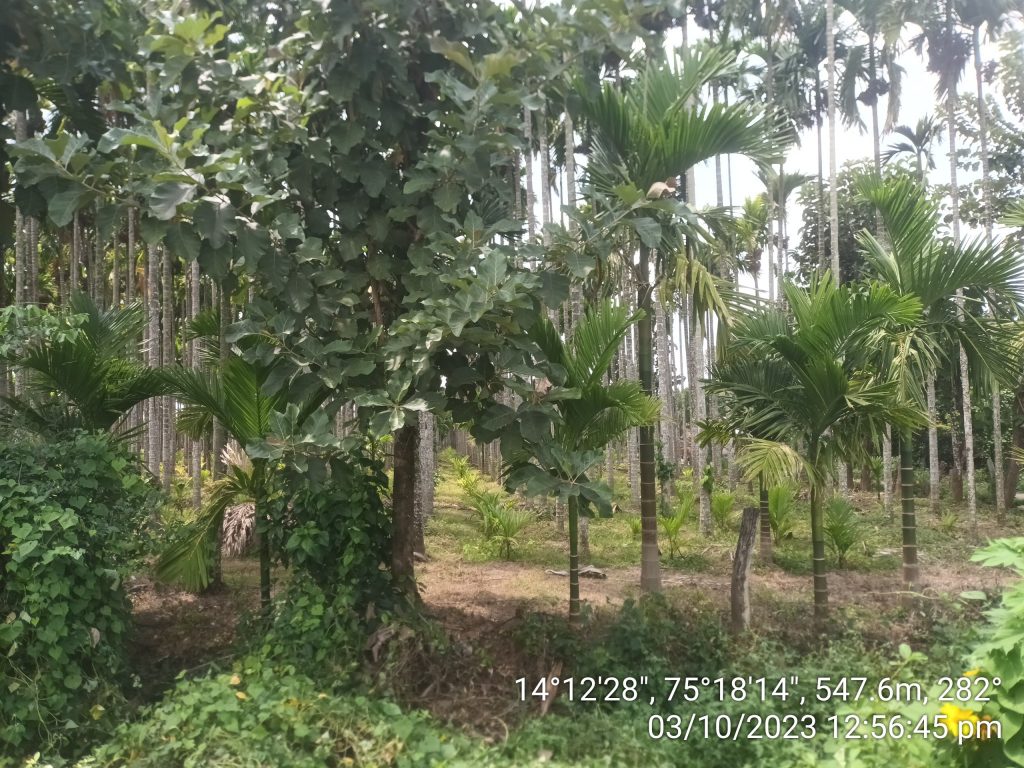
To mitigate the mistakes in round-1, in partnership with WELL labs and NYAS, a second round of ground-truth collection is ongoing in the Tungabhadra region of India. The procedure has been changed to collecting data on seasonal basis that includes an updated form that also takes the farm image as input that works as a proof of the crop type and the input data. The data collection exercise will be repeated in all 3 agricultural seasons to gather diverse data.
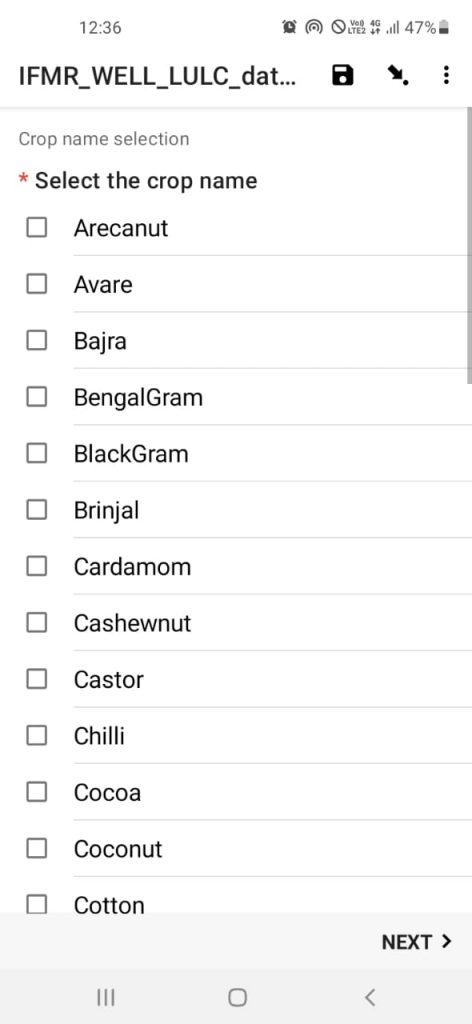
Some screenshots of the data collection app are shown below-

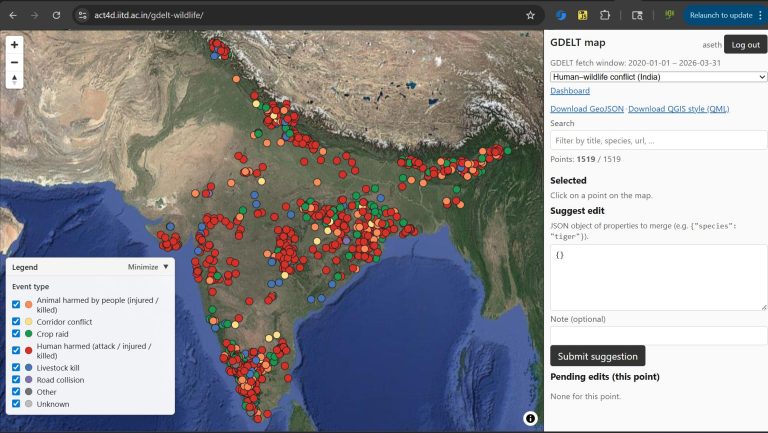
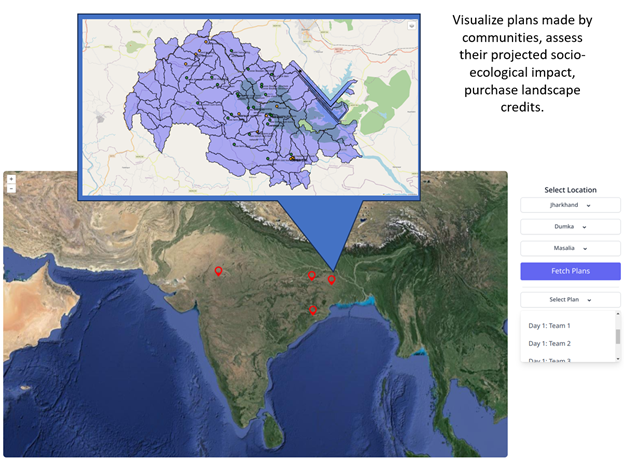
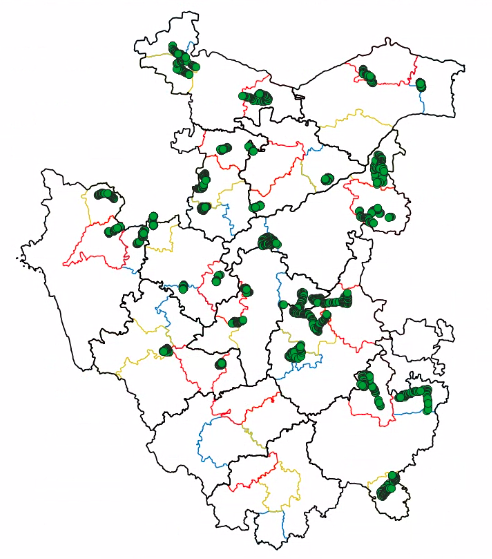
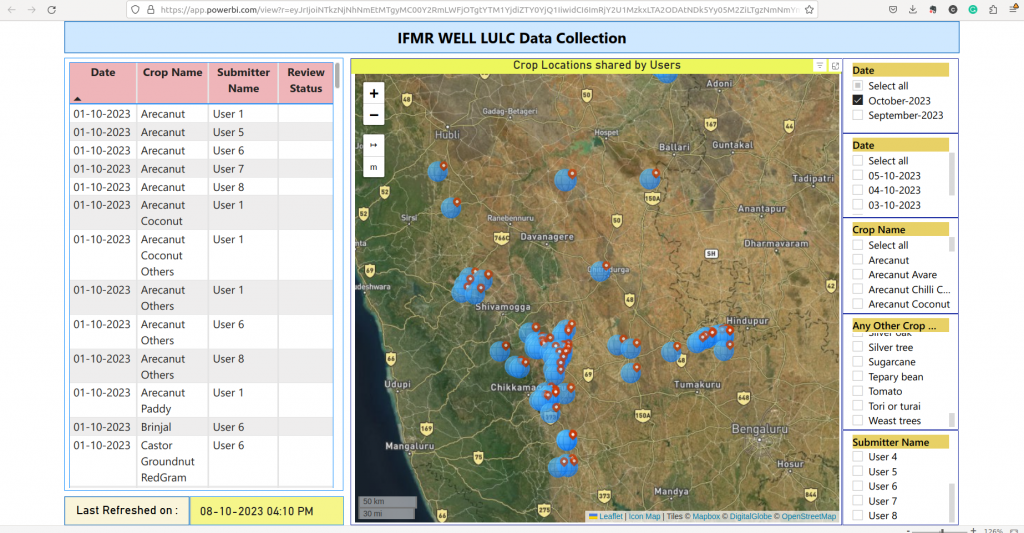
The team has successfully collected 2373 farm entries after data cleaning and is still going. The geographical coverage of these data points can be seen in the image below-
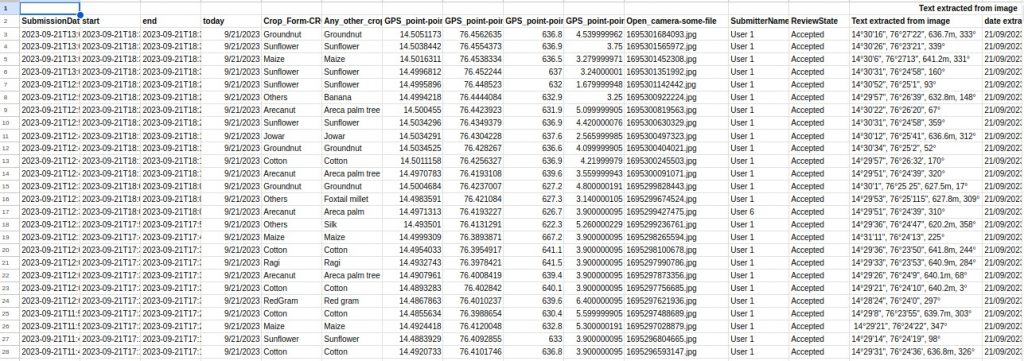
The data collected from the Tungabhadra region is being processed to extract useful information that can work as required ground truth data for validating the LULC pipeline. Below we show some snippets of the data collected so far.
The data will be hosted soon after the collection and pre-processing stages are completed.
Hosting Specifications
- Google Drive Link to codebase: Click Here
- Github Link to codebase: Click Here
- Earth Engine Output Path: asset path where final outputs will be hosted ’projects/ee-indiasat/assets/LULC CombinedOutputs WithConfidence/’
- Type of output: Raster
- Spatial Resolution: 30m
- Temporal Resolution: annual
- Temporal Availability: 2017-2022 hydrological years
See the draft manual for technical details on how each of these layers has been computed.