We had sent an update a few months back on our progress with putting together several novel geospatial layers through well-engineered machine learning pipelines and computational algorithms, automatically updated, along with several longitudinal socio-ecological indicators to understand different stresses in a landscape, with primarily water security as the primary theme to start with. See this draft technical manual for details.
Our engineering pipelines are now robust and we can generate these layers and indicators for any administrative block upon request. We are therefore now eager to engage more closely with partners to develop new use-cases and additional layers that they would need. Please do write to us to discuss any requirements. We believe that across civil society organizations, social enterprises, journalists, academia, and research organizations, these datasets can provide immense value. Please drop an email to contact@core-stack.org.
In the meantime, you can also browse some of the outputs so far:
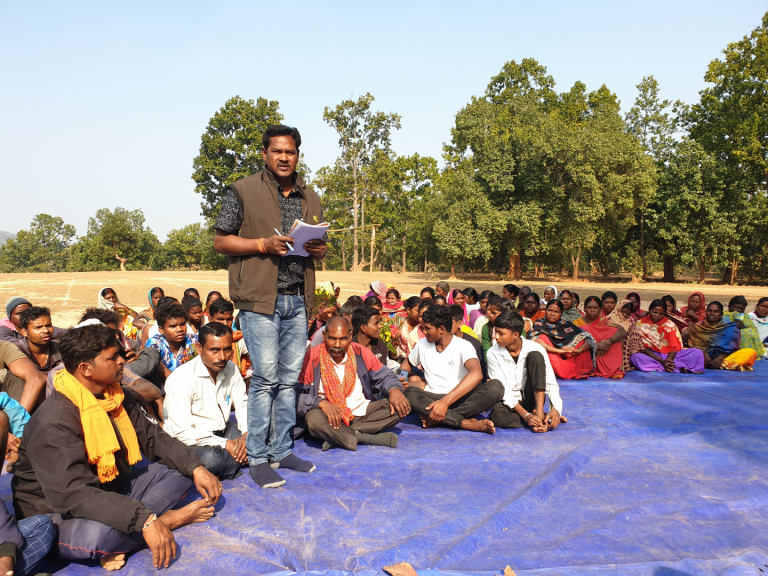
And take a look at the overall CoRE stack deck to understand our vision, including our flagship Commons Connect application to empower communities to do their own bottom-up participatory planning of natural resource management assets.
We have prepared the following layers so far:
- Pan-India hydrological boundaries: Basins, Sub-basins, Watersheds, Micro-watersheds.
- Pan-India drainage lines with stream orders.
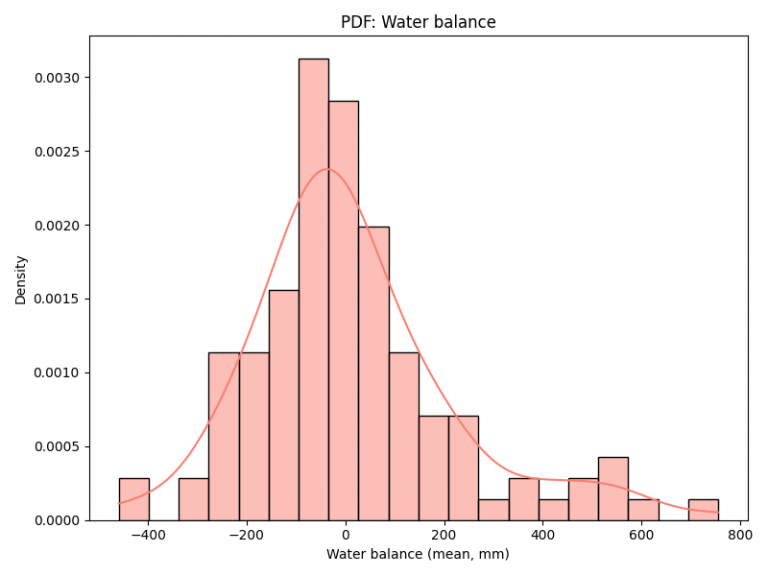
- Hydrological layers, of fortnightly time-series since 2016 computed for each micro-watershed, available as a vector layer:
- Precipitation
- Evapotranspiration
- Runoff
- Net water balance, recharge:discharge ratio
- Cumulative change in water balance
- Climate indicators: Drought intensity and drought frequency for mild/moderate/severe drought in a micro-watershed, computed annually for micro-watersheds since 2016, available as a vector layer. Additional indicators that feed into drought computation include the length of dry spells, SPI, rainfall deviation, etc.
- Land use and land cover classification since 2016, intra-annual, available as raster layers with classes for the following, for each block:
- Built-up
- Barren, shrubs and scrubs
- Water: Seasonal presence during the Kharif, Rabi, and Summer months
- Vectorized into water-bodies.
- Trees
- Cropping: Seasonal, with areas under Kharif, Rabi, Summer cropping
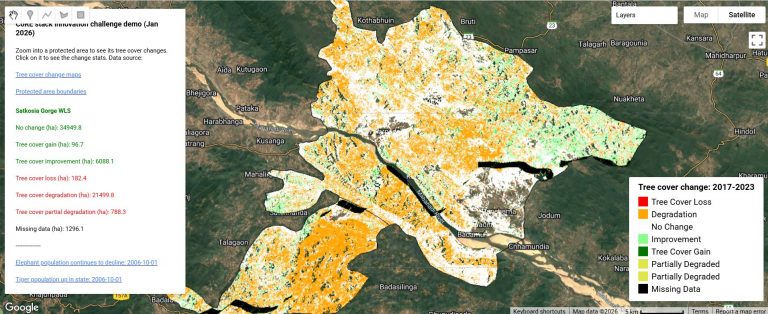
- Upcoming is a change layer to specifically describe LULC changes since 2016.
- Socio-economic variables computed for 2003, 2011, 2019, for villages, aggregated to the panchayat, block, and district levels.
- Aggregate Development Index. See this paper for details on how we built a deep-learning based classifier to estimate poverty levels from daytime and nighttime satellite imagery. In the absence of any recent census, these estimates can serve as a proxy indicator.
- Relative Wealth Index
- Census 2011 variables collated in one place: male/female literacy, SC/ST/Others population, asset ownership, etc.
- Terrain classification computed using digital elevation models, available as a raster layer for each block, with the following classes:
- Plain areas, further classified as low/mid/high plains, at low-lying areas or mesa tops.
- Broad open slopes, upper steep slopes, further classified as having local valleys or ridges.
- U-shaped valleys.
- Others: Mountain tops and ridges, V-shaped valleys.
- Panchayat level NREGA expenditure with equity indicators: Since NREGA is a demand-driven scheme, we have developed a method to estimate demand, and to compare this with the actual expenditure. A wider deviation would suggest that either adequate demand is not being generated, perhaps due to awareness or other issues, or the expenditure is less than what is required.
- Pan-India administrative boundaries: District, sub-district, panchayat, village
See the draft manual for technical details on how each of these layers has been computed.
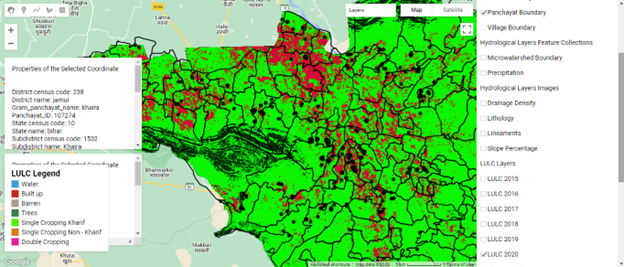
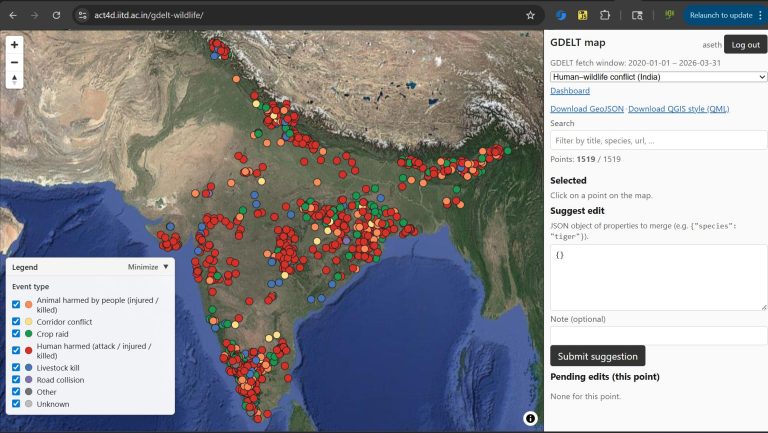
Figure 1. Glimpse of the Google Earth Engine application
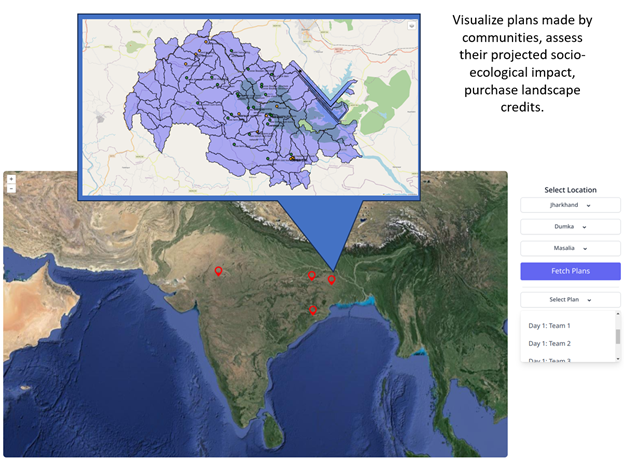
Figure 2. Glimpse of the Landscape Explorer dashboard to download layers and review plans