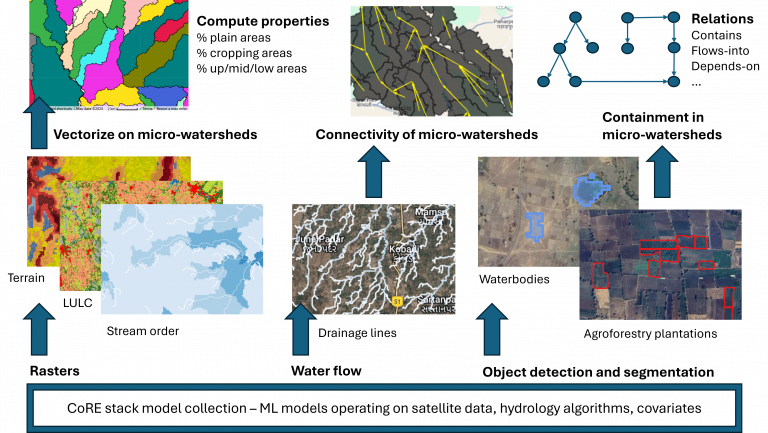
To accompany the innovation challenge (main doc with example problems), we have built a starter-kit that shows how you can define and populate CoRE stack data structures.
The starter-kit outlines how you can invoke CoRE stack APIs to get a list of geospatial layers for a given location containing tons of pre-computed data about the place, then extract the data into a data structure defining a tehsil that contains micro-watersheds, and which contain waterbodies, and finally flatten the data structure into a dataframe of micro-watersheds that can be used to answer interesting questions.
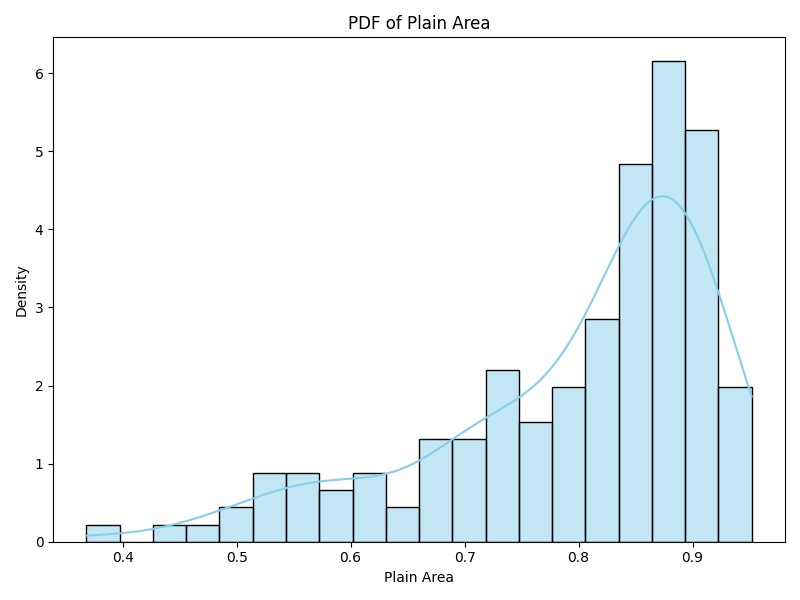
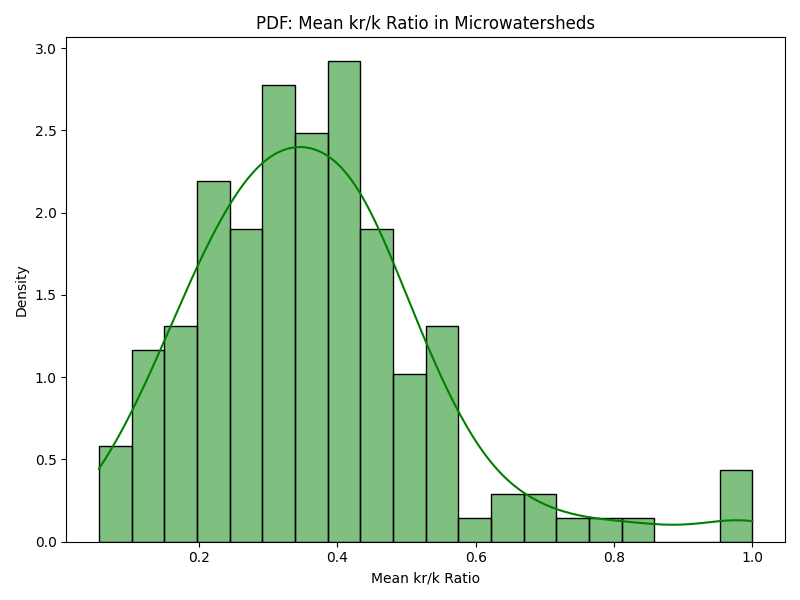
For example, it was a simple matter of minutes to use the starter-kit to produce this comparison of two tehsils, Bhavnagar in the Bhavnagar district in Gujarat and Devadurga in the Raichur district in Karnataka. Both Bhavnagar and Devadurga are semi-arid areas that get about 700mm rainfall, but Bhavnagar has mostly rainfed agriculture while Devadurga has canal based irrigation as well as extensive groundwater usage. The graphs below show how similar they are in terms of some key geographic features: Both have micro-watersheds that have mostly plain areas (density graph skewed to the right). And for both surface water remaining up to the Rabi season, as a fraction of surface water area during the Kharif season, is quite less (density graph skewed to the left).
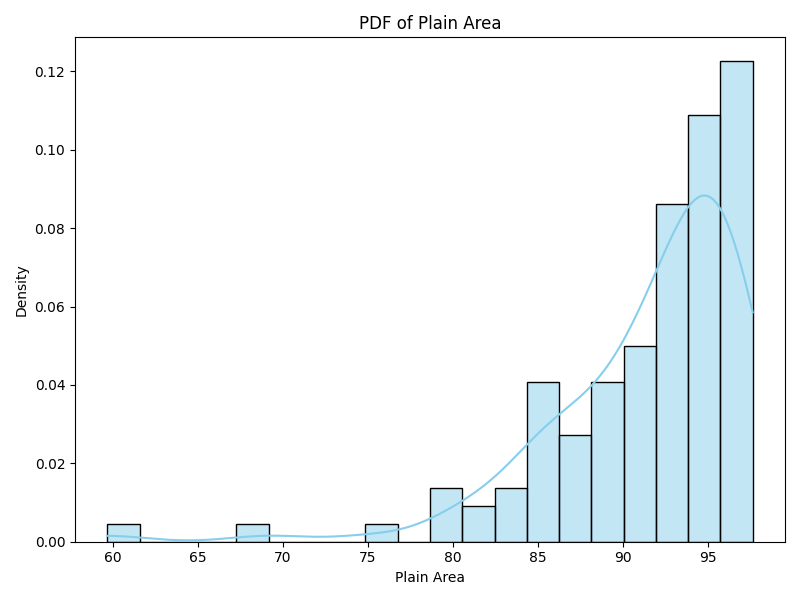 | 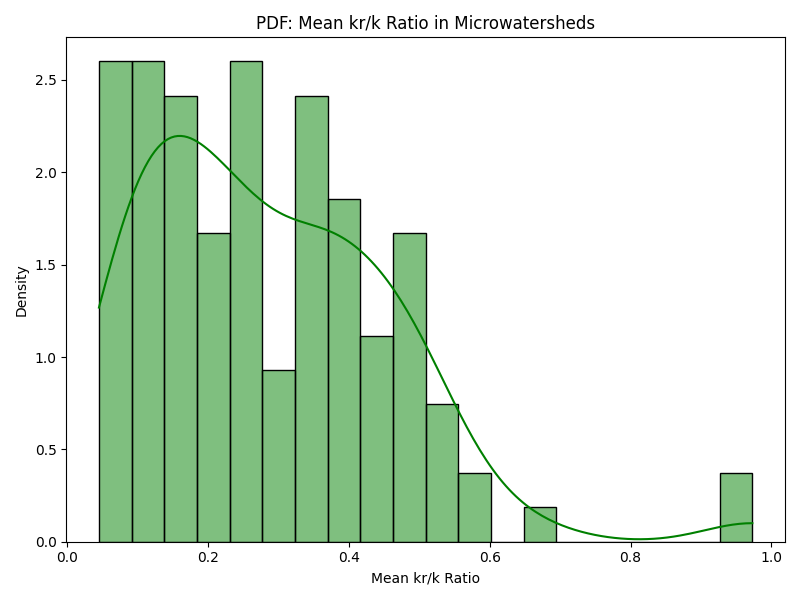 |
| Figure 1a, b: Bhavnagar: % of plain area, % surface water area during Rabi to Kharif | |
 |  |
| Figure 1c,d: Devadurga: % of plain area, % surface water area during Rabi to Kharif | |
But compare the two locations now based on how their cropping intensity varies with respect to other parameters. Bhavnagar, below, has many micro-watersheds with a positive vertical water balance (defined as Rainfall – Evapotranspiration – Runoff), and cropping intensity varies inversely with water balance (areas with high cropping intensity have a lower water balance). Cropping intensity also varies directly with availability of surface water area, with higher intensity in areas with higher surface water availability. There does not seem to be any specific relationship between cropping intensity and drought frequency. Overall, this seems to be a strong signature of rainfed agriculture with high dependency on surface water. Further analysis on drought sensitivity (a proposed problem for the innovation challenge) can reveal the need for better drought protection infrastructure as well as the scope to expand cropping intensity into the Rabi season.
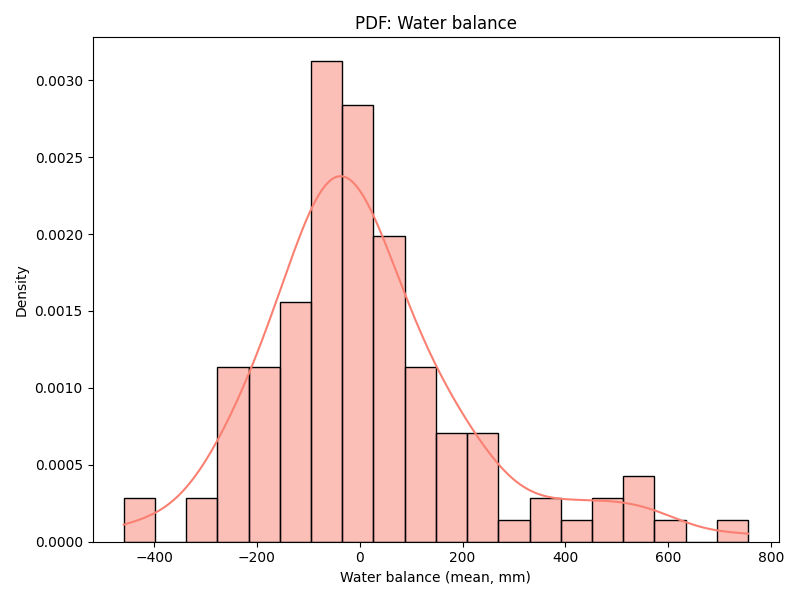 | 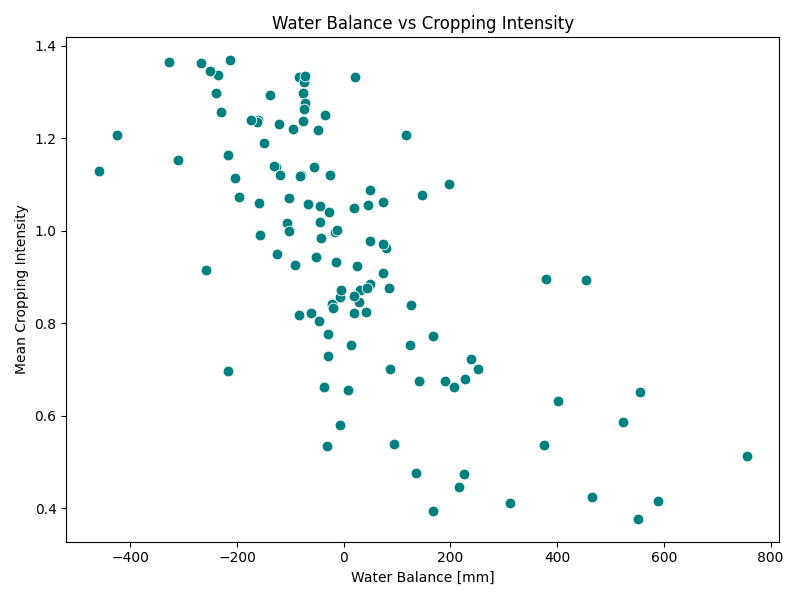 |
| Figure 2a: Bhavnagar, annual water balance | Figure 2b: Bhavnagar, cropping intensity against water balance |
 |  |
| Figure 2c: Bhavnagar, cropping intensity against Rabi to Kharif surface water availability | Figure 2d: Bhavnagar, cropping intensity against drought frequency |
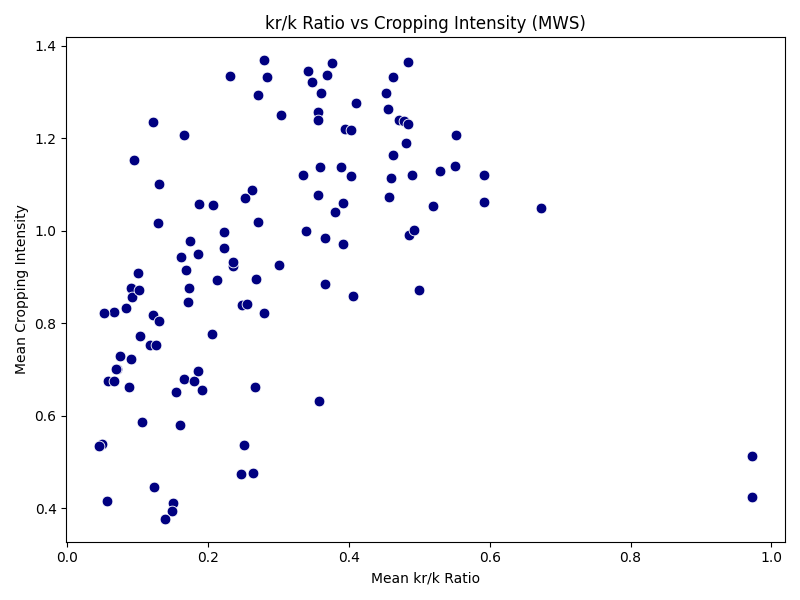
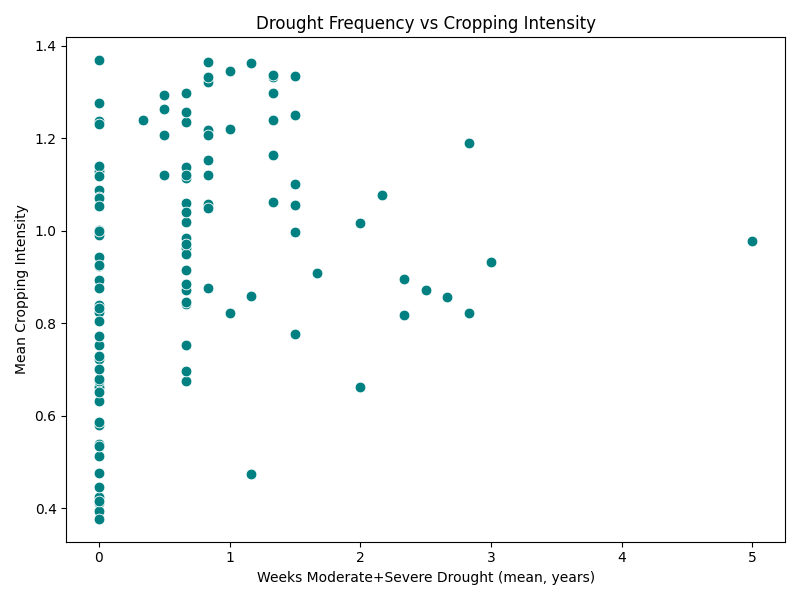
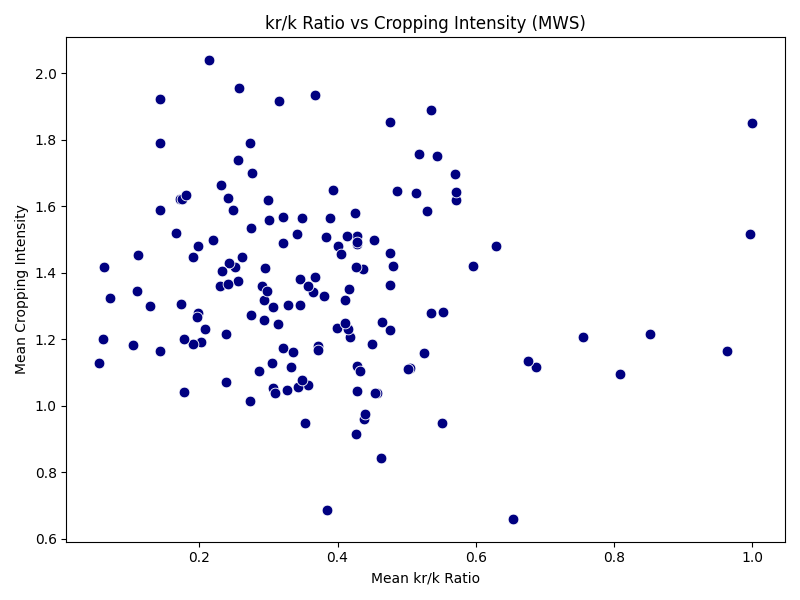
Let us now look at Devadurga, below. First of all, the water balance is negative in all micro-watersheds, showing that the water deficit is either being fulfilled from groundwater or external surface water flows like canal irrigation. Since this distribution is likely to be quite heterogenous, there also does not seem to be any relationship between cropping intensity and water balance. The cropping intensity in general is also quite higher than Bhavnagar. Similarly, there does not seem to be any relationship with surface water availability ratio between Rabi to Kharif either, showing that other irrigation sources offset the reliance on surface water alone. And even though Devadurga seems to be have a higher drought frequency, the cropping intensity does not have any relationship. Overall, this points to a strong signature for irrigated agriculture with potential groundwater stress and low resilience.
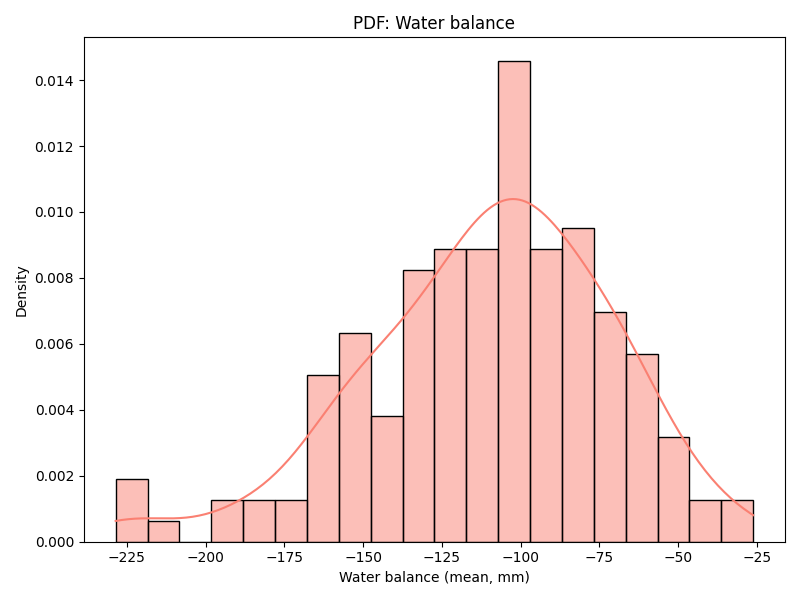 | 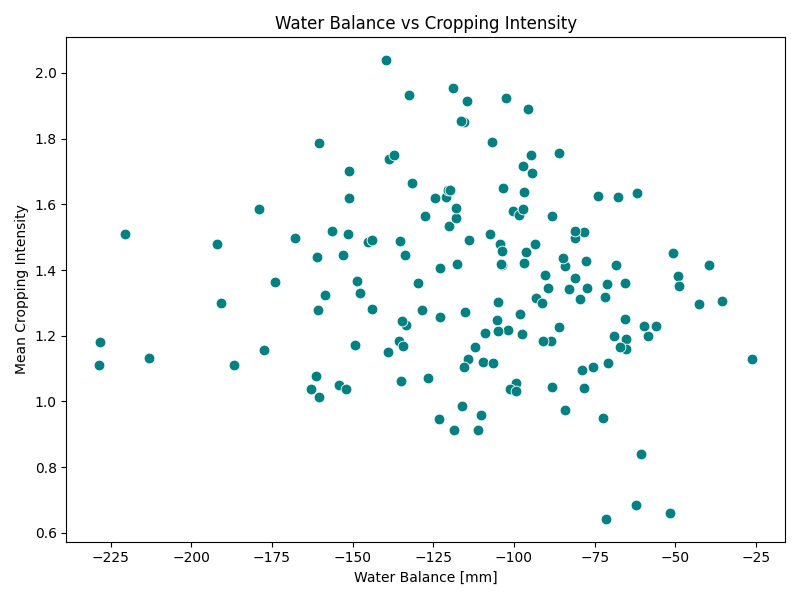 |
| Figure 2a: Devadurga, annual water balance | Figure 2b: Devadurga, cropping intensity against water balance |
 | 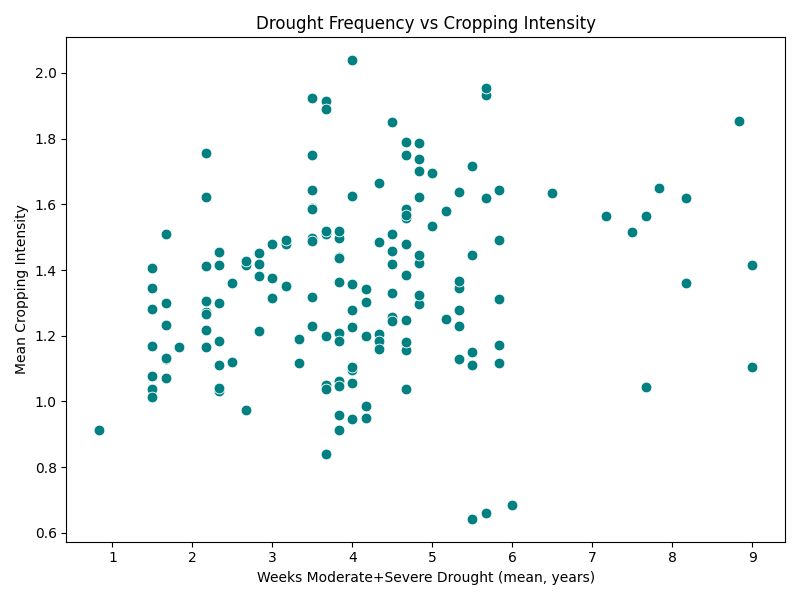 |
| Figure 2c: Devadurga, cropping intensity against Rabi to Kharif surface water availability | Figure 2d: Devadurga, cropping intensity against drought frequency |
The above analysis is meant entirely as a demonstration. Many more variables should be tested before we draw any strong conclusions, and that’s what the innovation challenge is meant to do.
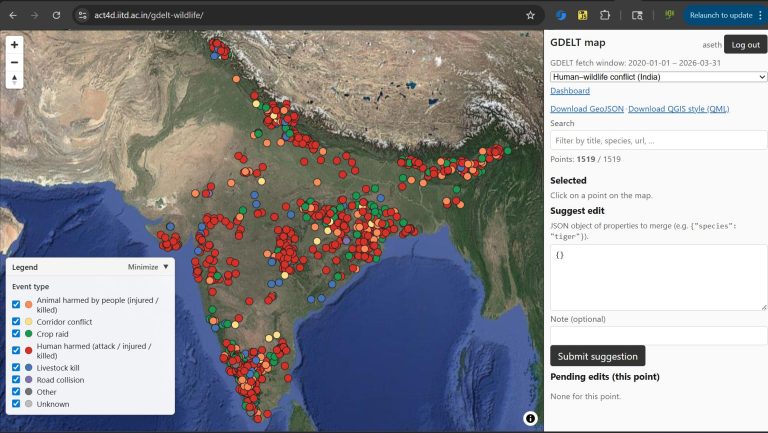
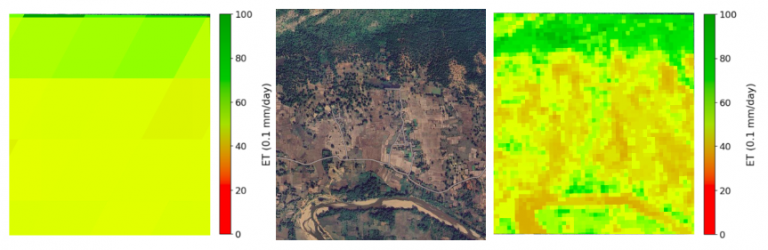
But this is also shows that this is just the tip of the iceberg. The CoRE stack already holds data for over 200 tehsils where our partners are working. The Know Your Landscape dashboard can help you get a quick sense of the type of data. The data spans hydrological variables like the ones above, along with data on tree cover changes, finer data like rainfall and evapotranspiration on a fortnightly basis, drainage lines, NREGA works, socio-economic data at the village level, and more (technical manual). Plus, a lot of data has not been pulled into APIs as yet but those comfortable with handling large datasets, and with using computing platforms like Google Earth Engine, can access the data available on our pan-India GEE app. Some of the most interesting data that can lead to richer analysis includes a connectivity graph of micro-watersheds, river network, canal network, and partially complete datasets on the locations of mines, factories, conflict areas, etc.
Do check out the starter-kit to understand the CoRE stack data structure and how to pull in data from various underlying geospatial layers, the APIs which can provide even easier access to many key datapoints, the STAC specs to understand the data, and participate in the innovation challenge. Tons of interesting hypotheses can be tested easily, plus new hypotheses can be created by noticing interesting patterns in the data!
For more discussions, please join the Googlegroup and Discord channel, and participate in weekly community calls on Fridays 3-4pm IST.
And there is tons of new data and computation pipelines that you can help to contribute and enrich the CoRE stack.