Most land cover maps answer where water is. This blog is about a model that answers the harder question: when.
Why when matters
A yearly land cover map marks a pond as water if it held water at some point in the year. For a watershed team that hides the thing they most want to know. A farm pond that still holds water in February can irrigate a rabi crop; one that dries out in October cannot. A check dam that keeps water a month longer after desilting is the evidence that the work paid off. Both ponds look the same on a yearly map.
Small and seasonal water is also exactly where yearly maps are weakest. They are built mostly from optical imagery, and through the monsoon, when seasonal water fills, clouds hide the ground for weeks at a time. Many small ponds are missed altogether.
So we built a model that calls every 10 m pixel of India water or not water once a fortnight, over any date range, through the monsoon.
How it works
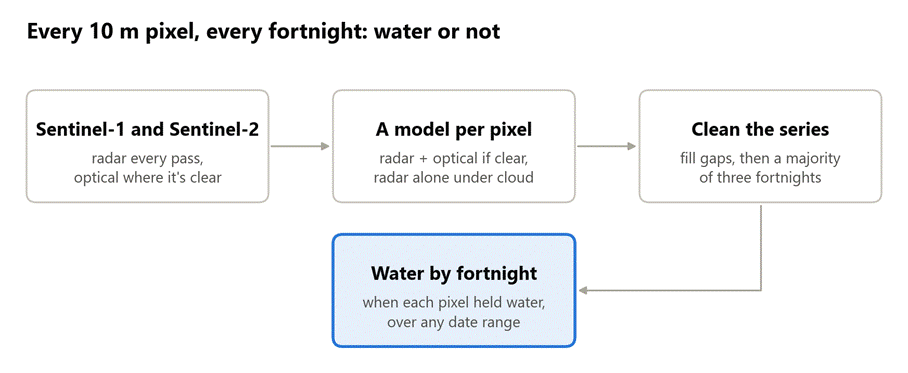
Figure 1: From Sentinel imagery to water by fortnight.
- Two satellites. Sentinel-1 is a radar satellite: it sees through cloud, day or night, but its view of small water is coarse. Sentinel-2 is optical: sharp on water when the sky is clear, blind under cloud. For each 14-day slot the model takes the median radar picture and the median of whatever cloud-free optical views exist.
- A model chosen per pixel. Where a pixel has a clear optical view that fortnight, a model that reads radar and optical together decides. Where cloud hides it, a radar-only model decides. Where there is no radar pass but the sky is clear, an optical-only model decides. Where there is neither, the fortnight is left blank for the next step.
- Small ponds. Each of those models has a twin that also looks at the average of the 3 by 3 and 5 by 5 pixels around it. A pixel is water if either one says so. On regions and years the model never saw, the twin lifts ponds under 1,000 m² from 0.38 to 0.56 F1, and keeping the plain model alongside stops narrow river channels from being lost.
- Clean the series. A blank fortnight takes the last state seen. Then each fortnight takes the majority of itself and its two neighbours.
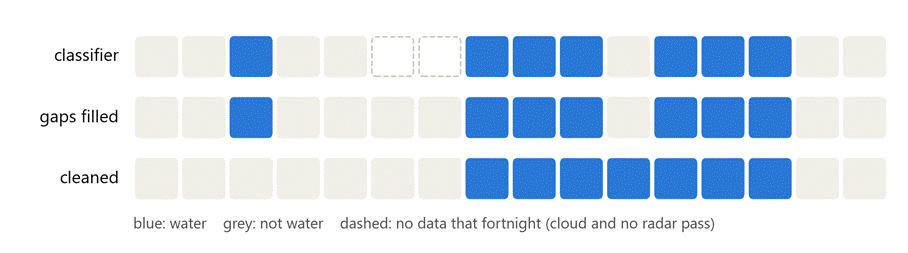
Figure 2: One pixel over sixteen fortnights. The lone wet fortnight goes, the one-fortnight dry gap inside the wet spell is filled, and the spell itself is kept as the model saw it.
Every model is linear: a weighted sum of a handful of bands and indices. That is plain arithmetic on images, so a whole district runs inside Google Earth Engine with no imagery downloaded. The model needs nothing but Sentinel-1 and Sentinel-2.
The details that mattered
- Radar under cloud is not optional. Over Jalpaiguri district in 2024, a clear optical view existed on 78% of fortnights over the year, but only 57% through kharif, and 0.9% in the first fortnight of July. With optical withheld the way the monsoon withholds it, a model with no radar fallback finds only 55% of the water; choosing the sensor per pixel lifts F1 from 0.67 to 0.84.
- The cleaning is light on purpose. A majority of five or seven fortnights gives a cleaner looking map, but it decides how long water lasts: a majority of seven deletes every wet spell under about eight weeks. It trades seasonal water for precision at no gain in F1 (0.831 for three, 0.830 for five, 0.825 for seven), so the timing stays the classifier’s. Even the light version takes false water from 31% of land points to 12%.
- The edges of a range. The first and last fortnights have only one neighbour. So the series is built with two extra fortnights on each side, cleaned, then trimmed. On a test box whose range began in August, leaving this out changed 18% of the wet pixels at the edges.
- Any range, across years. The range can start and end on any date, for example November 2023 to August 2024, and is cleaned as one series with no seam at the new year.
- Labels with dates. The model learnt from 876 hand-drawn polygons of 205 water bodies across India, each outlined as water or not water on a specific date between 2016 and 2025. A strip of land 15 to 45 m outside each water outline was labelled not water, so the model learnt the bank, the field and the road right next to the water, the land it is most likely to confuse.
- One input we took out. The model used to set every pixel that ESA WorldCover maps as built-up to not water. Measured on independent ground truth it bought almost nothing: F1 0.835 with it, 0.831 without. False water on built-up land goes from 0.8% to 6.5%, still under Dynamic World’s 10%. We dropped it, so the model depends on no other land cover map.
How well it does
We scored June 2023 to May 2024 on 793 water points and 16,446 land points from five sets of hand-labelled polygons, none of which share a water body with the training data. A point counts as water if it was wet in any fortnight. Recall is averaged over three sets of water and false water over six kinds of land, so that the many built-up points don’t decide every number.
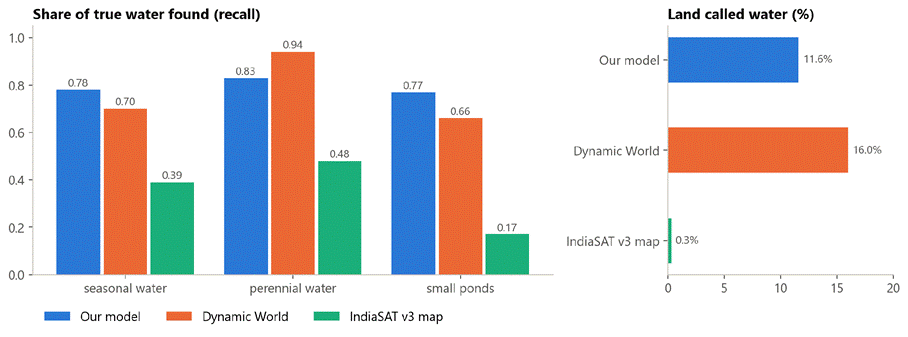
Figure 3: Share of true water found, by kind, and share of land called water. June 2023 to May 2024, independent ground truth.
| precision | recall | false water on land | F1 | |
| Our model | 0.87 | 0.79 | 11.6% | 0.83 |
| Dynamic World | 0.83 | 0.77 | 16.0% | 0.80 |
| IndiaSAT v3 map | 0.99 | 0.34 | 0.3% | 0.51 |
- More water than Dynamic World, with over a quarter less false water.
- Best on small and seasonal water, the water existing maps miss: 0.77 of small ponds against 0.66 and 0.17, and 0.78 of seasonal water against 0.70 and 0.39. Dynamic World is better on perennial water, which is large and seen in every season.
- IndiaSAT’s map is the most careful: almost nothing it calls water is wrong, but it finds a third of the water.
Two honest caveats. Precision above is the precision if water and land were equally common. On the points as they are, where water is under 5% and most land is built-up, plain precision is 0.32 for our model and 0.23 for Dynamic World. And the lead over Dynamic World is small: our F1 is ahead in 96% of bootstrap draws over whole polygons, but the 95% interval of the difference just touches zero.
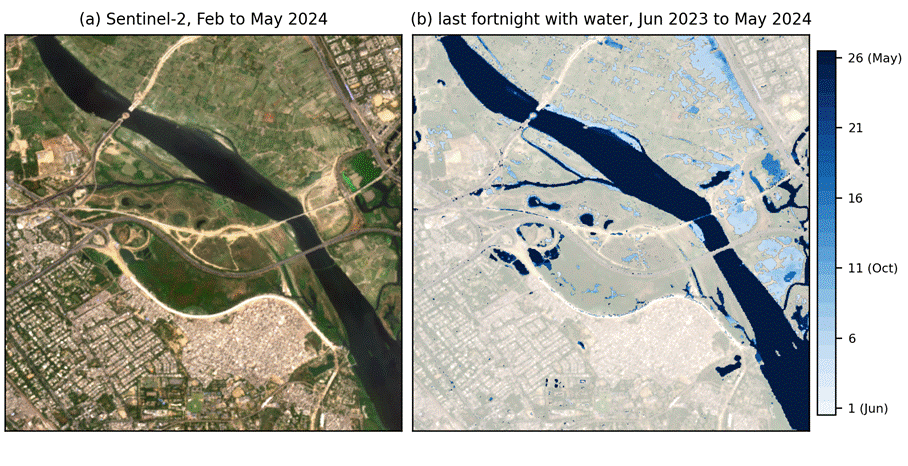
Figure 4: The Yamuna in Delhi. Right, the last fortnight of the June to May year each pixel held water: the river is dark all year, the floodplain fields and ponds pale where they dried early.
Where it is weak
- Flooded fields. Most of the false water is standing water on fields in the monsoon (19% of farm points), which is real water, on land labelled farm.
- Very small or very brief water. Ponds under about 500 m² and wet spells shorter than a fortnight are below what 10 m pixels and two-week steps can resolve. Radar alone can’t resolve ponds under 1,000 m², so a pond under cloud for the whole monsoon is a hard case.
- Sparse timing labels. The training polygons have about four dates per water body, and the evaluation polygons are undated, so the timing of filling and drying is learnt from snapshots and is checked per date only on held-out training bodies.
Optional: let an existing map say where
Existing maps are very precise about where water can be. So the model can also run inside a where layer: keep a pixel as water only if Dynamic World or IndiaSAT saw water there this year or in the four before, and only where it sits no more than 20 m above its nearest stream. That cuts false water from 11.6% to 6.6% and keeps F1 at 0.83, at the cost of recall (0.79 to 0.76) and of small ponds (0.77 to 0.71), the water those maps never saw. It suits uses where false water costs more than missed water. Where small and seasonal water matters most, use the model alone.
Try it
The model is open source at github.com/salil-123/corestack-water: one readable Python file, the model weights as a small JSON file and a notebook that maps a district. Give it a boundary and two dates, and it writes a GeoTIFF with one band per fortnight (1 water, 0 not water, 255 never seen) or the weeks of water per pixel.
Next, we want to score the timing itself against water bodies watched through a season, and to turn the fortnight raster into a fill and dry date for every water body in a district.
If you have feedback, find a bug, or have water bodies whose seasons you know, write to us at contact@core-stack.org.
Contributors: Salil Gujar and Dr. Aaditeshwar Seth, IIT Delhi.