Field data collection sounds simple in theory: go out, observe things, record what you find. In practice, it quickly turns into dozens of audio files, scattered notes, random GPS logs, and a vague memory of “somewhere near that big tree.” We learned this the hard way while working on bird audio surveys. The work was fun, the data management was not.
We wanted a tool that made fieldwork more efficient and less error-prone. Something that keeps the spatial context intact, helps you stay organized, and doesn’t require complicated GIS workflows just to view where a recording was taken. And while we were at it, why not also make the whole thing run locally so researchers actually own their data without requiring SaaS services and complex server management?
That is where this toolkit began.
Github: https://github.com/xHrid/continuous-ecological-monitoring-toolkit
What we built
This is a self-hosted data collection system designed for ecological monitoring, or any field project where location matters. It aims to sit right between simple GPS loggers and full-blown GIS software. You just need a computer you can leave running at your home before you head out to the field, and you need your phone while in the field.
You can:
- Define a study site anywhere in the world.
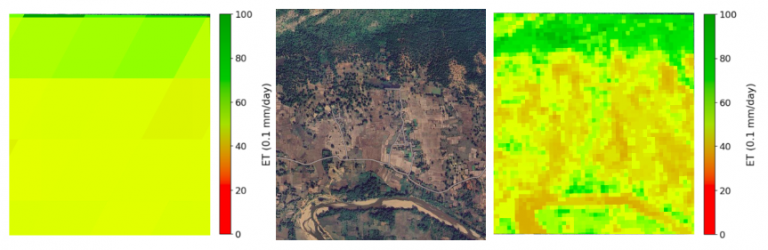
- Automatically generate land-cover stratification maps for that site based on spectral data captured from satellites like Sentinel and Landsat.
- Capture “spots”, interesting locations with notes, photos, or audio.
- Record the routes or transect walks you take while surveying.
- Attach external files to these spots or routes so nothing gets lost in a folder maze. You can keep going back to the same spots and routes so that future data collection gets automatically attached to them.
- Run processing scripts (like acoustic analysis) directly from the interface.
Everything you collect is saved neatly on your own machine. No cloud dependencies. No accounts. Just your data.
Why spatial context matters
Ecological observations without location are like field notes without dates. Without knowing where something was found, it’s difficult to build any meaningful understanding. Yet spatial information is often the first thing that gets lost when data is handled manually.
This toolkit places a map at the center of the workflow. Every recording, photo, or note is geotagged. You can always revisit the exact spot later, or ask someone else to.
Walkthrough of the main features
Sites
Start by adding a study site with a simple KML file. The boundary gets loaded instantly, and if you choose, the toolkit can create stratified overlays using Google Earth Engine automatically.
These overlays break the site into clusters of similar land cover and vegetation type. It’s incredibly useful for planning surveys and making sure effort is spread across different habitat types. And yes, the technical details of how that works are written up clearly on GitHub if you’re curious.
Spots
A spot is any location worth remembering. Maybe you found a rare bird, a unique tree, or just a place you know you’ll come back to. Each spot can hold notes, timestamps, photos, audio, and multiple observations over time.
Think of it as a timeline pinned to a point on the map.
Routes
Routes help track the ground you cover. Press record, start walking, save when you finish. Ideal for transects, patrolling, or just making sure you don’t survey the same patch five times while ignoring another.
External Data
Lab results, spreadsheets, reference images, attach anything you want to a spot. At least now all your relevant files live together instead of in a “final_final_updated.xlsx” floating around.
Analysis
You can run custom analysis scripts directly from the interface. The app handles the background processing and stores outputs in the right place. You keep working while your laptop does the heavy lifting.
Local-first by design
A lot of research tools push your data to someone’s server. That’s not always ideal when working with sensitive ecological information or preliminary datasets you’re not ready to share.
Here:
- The server runs locally. This can be your home computer that can remain switched on while you are in the field.
- Everything is stored in a transparent folder structure.
- You can back it up or migrate it however you like.
You stay in control, permanently.
Who can use it?
We built this with ecologists in mind for biodiversity monitoring, but it can also be used for:
- Urban planning and infrastructure surveys
- Geological and physical field sciences
- Explorers who just like documenting the world
If your work involves physical places and collected observations, this can help.
Try it out
The full documentation and setup steps are available on GitHub. If you’re comfortable running a small local server (Python + FastAPI), you can be up and exploring your own data within a few minutes.
Github: https://github.com/xHrid/continuous-ecological-monitoring-toolkit
Feedback, issues, ideas, all welcome. This toolkit will keep evolving, and we’d love to hear how you’re using it in your field projects.
This started as a way to save us from drowning in audio files and misplaced coordinates. It has grown into a flexible system for structured ecological data collection. We hope it makes your fieldwork a little more organized, and maybe even a little more fun.
We are still refining and improving the application and getting feedback. Please write to us at contact@core-stack.org with any feedback and suggestions.
Authors: Hridayansh Sharma, Rajasree Ponnada, Kashvi Khurana, Rachit Aggarwal, Srinath Ganji, Gaurav Rajput, Parth Thakur, SS Jayakrishna, Aaditeshwar Seth. Indian Institute of Technology Delhi.