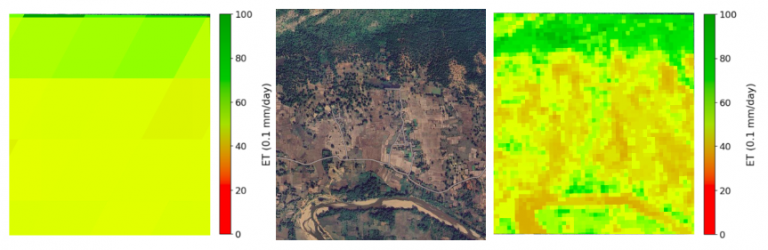
Author: Ratinder Pal Singh, MTech student, IIT Delhi
Soil health is central to sustainable agriculture, fertilizer planning, and long-term crop productivity. India’s Soil Health Card programme provides a large number of ground-level soil observations, but these observations are available only at sampled locations. For regional planning, we need continuous maps that estimate soil properties across the landscape.
This project builds a Pan-India machine learning pipeline to generate 30 m resolution soil health maps for four key indicators: Nitrogen, Phosphorus, Potassium, and Organic Carbon. The detailed thesis can be found here.
Approach
India is environmentally diverse, with large differences in rainfall, soil type, temperature, terrain, and cropping systems. To handle this diversity, the country was divided into 18 Agro-Ecological Zones. Separate Random Forest models were trained for each nutrient in each AEZ, giving 72 models in total.
The models use Soil Health Card samples as ground truth and combine them with satellite and environmental features. These include Landsat-based spectral and vegetation indices, MODIS temperature, CHIRPS precipitation, SRTM topography, and SoilGrids soil texture and pH variables. This allows the models to learn how soil nutrients vary with climate, vegetation, terrain, and baseline soil properties. Significant data cleaning was done to reject obvious outliers, soil health cards geo-tagged on non-cropping LULC, and so on.
Outputs
The final system produces 30 m prediction layers for:
- Nitrogen
- Phosphorus
- Potassium
- Organic Carbon
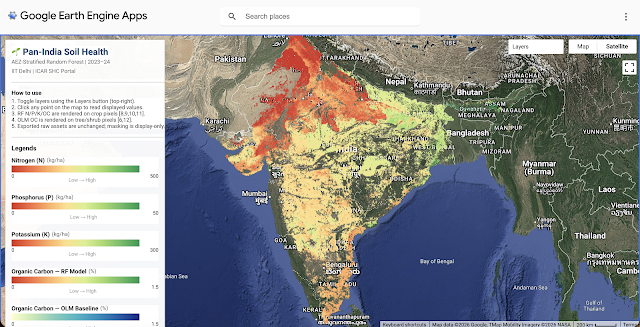
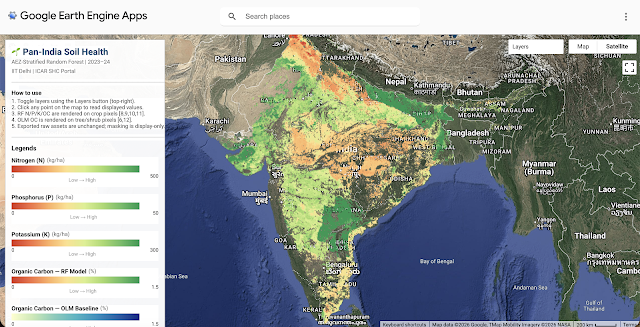
The AEZ-wise outputs are stitched together into Pan-India layers and deployed in a Google Earth Engine application. The app allows users to toggle between nutrient layers and inspect values at any location using a point inspector.
GEE app link: https://ee-mtpictd-ratinder-mcs.projects.earthengine.app/view/pan-india-soil-health-maps
The maps will soon be included in the CoRE stack for decision support.
Pan-India map outputs
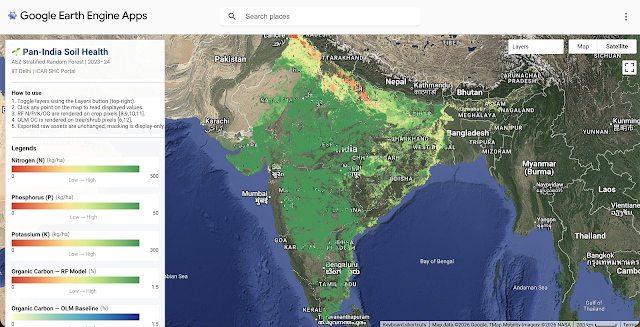
The following maps show the five Pan-India layers available in the Google Earth Engine application: Nitrogen, Phosphorus, Potassium, Organic Carbon from the custom Random Forest model, and Organic Carbon from the OpenLandMap baseline.
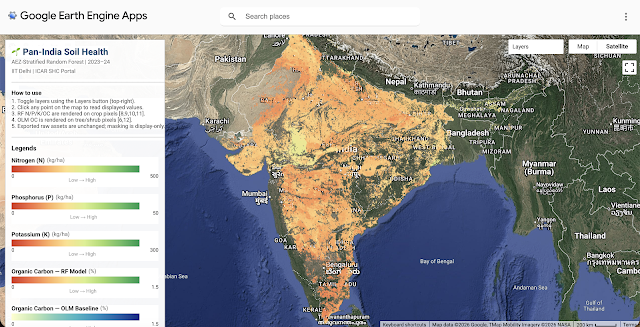
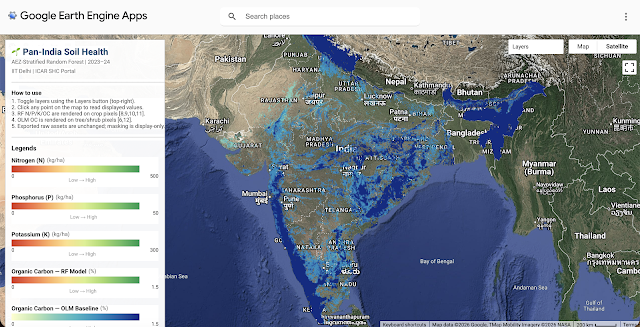
Open Land Map comparison
Our soil-health card trained Soil Organic Carbon (SOC) model was compared with the global OpenLandMap SOC baseline. This comparison showed that global soil products may not represent Indian cropland conditions accurately.
OpenLandMap showed three major limitations in this setting. First, its native resolution is coarser than the 30 m output our model produces. Second, its values are quantized, which creates rigid value steps instead of smooth local variation. Third, it tends to overpredict Organic Carbon for Indian croplands, likely because global models are influenced by soil conditions that differ from intensively cultivated tropical regions.
Our AEZ-stratified models performed better because they were trained directly on Indian Soil Health Card samples and could learn local relationships between soil properties and environmental conditions.
Github repository
The GitHub repository contains training-inference-export notebooks to generate AEZ-wise prediction layers. All 72 models can also be trained in one run. The base training data is provided as well.
GitHub repository link: https://github.com/Singhratinder/Soil-Health-Mapping-PanIndia
Conclusion
This project converts point-based Soil Health Card observations into continuous 30 m soil health maps for India, over cropping regions. By using AEZ-wise machine learning models trained on local Indian soil samples, the system captures regional soil patterns better than a generic global baseline.
The final production-ready outputs are raw, unmasked, grid-aligned, and accessible through a Google Earth Engine application. This makes the layers easier to use in downstream systems, where different LULC masks or agricultural filters can be applied as needed.