What 6 Lakh Indian Villages Tell Us About Rural Development
Amit Kumar, CoRE Stack; Ananya Singh, IIT Delhi
Research supervision: Aaditeshwar Seth, IIT Delhi
The Mission Antyodaya 2020 survey records rural development through a large number of variables covering public services, institutions, infrastructure, livelihoods, agricultue, health, water, sanitation, and connectivity. Read separately, these variables are difficult to compare and do not readily show how different aspects of a village interact. Our analysis reduces this complexity to a smaller set of indices while retaining the component features needed for diagnosis and further analysis.
Data Preparation
Of the 198 parameters available across 32 state and union territory files, 121 were selected for analysis. They were transformed into 64 features using normalization, binary availability measures, inversion, ratios, ordinal mappings, and composite scores. All features were oriented so that a higher value represents more of the measured positive condition. Examples include piped-water coverage, hours of domestic electricity, child nutrition and development, land utilization, agricultural risk support, and access to markets.
The 64 features were then organized into 21 broad categories, and each category was scored as low/medium/high by clustering the features within each category into distinct bands. Figure 1 shows this as an example for the Maternal and Child Health category, where five features were used to develop these distinct clusters using K-means. For example, in the High scoring cluster, newborn health outcomes and maternal health and care access sit relatively high, while health scheme utilisation sits lower and is more widely spread, when compared with the Medium scoring and Low scoring cluster. This reduction of the original 121 variables to simpler 21 category scores makes the whole data easier to understand and work with.
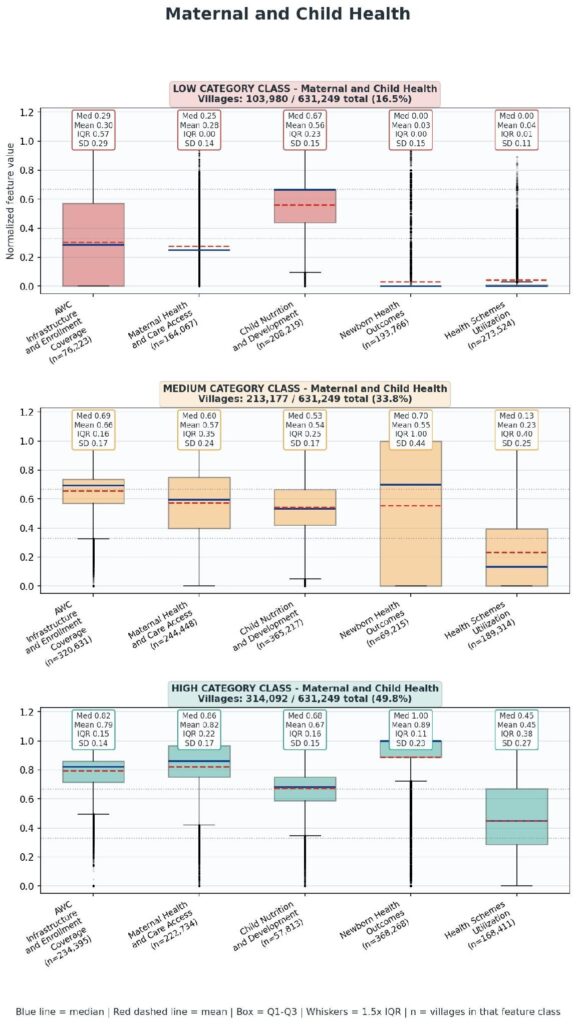
Figure 1: Maternal and Child Health feature distributions across the three category classes.
Using the Category Scores: By composing different categories together, some very interesting patterns can be observed. For example:
Water-security pressure
Pattern: High Employment + Medium/High Land Cultivation + Low Irrigation and Watershed development. This combination points to places where livelihood dependence and land cultivation are substantial but water-security is weak.
Agriculture without protective systems
Pattern: Medium/High Land Cultivation + Low Agriculture Support Services + Low Agricultural Markets + Low Financial Inclusion. The filter points to places where land cultivation is high but agricultural support, finance, storage, and market access are weak.
Institutions without economic conversion
Pattern: High Institutionalization + Low Financial Inclusion + Low Agricultural Markets. This pattern would indicate places where institutional through SHGs and Cooperatives is good, but links to finance and markets remains weak.
Connectivity without local economic conversion
Pattern: High Road Connectivity + High Energy Access + Low Financial Inclusion + Low Agricultural Markets + Low Cottage and Traditional Industry.This pattern would indicate places where road connectivity and energy are present, while financial, market, and enterprise systems remain weak. The same logic can also be interpreted as places where there is easy opportunity for market expansion.
.Spatial Analysis
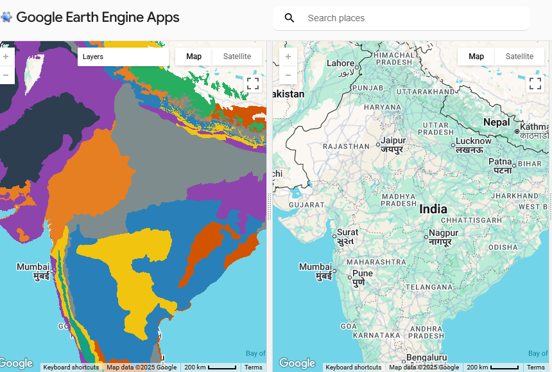
Figure 2 shows an example with the Water and Sanitation category. Darker areas indicate clusters of villages with better water and sanitation conditions in the Antyodaya data; pale areas indicate clusters facing poorer conditions. The strong spatial correlation in the map shows that neighbouring villages indeed share many shortfalls which can be distinct from patterns in the larger state context.
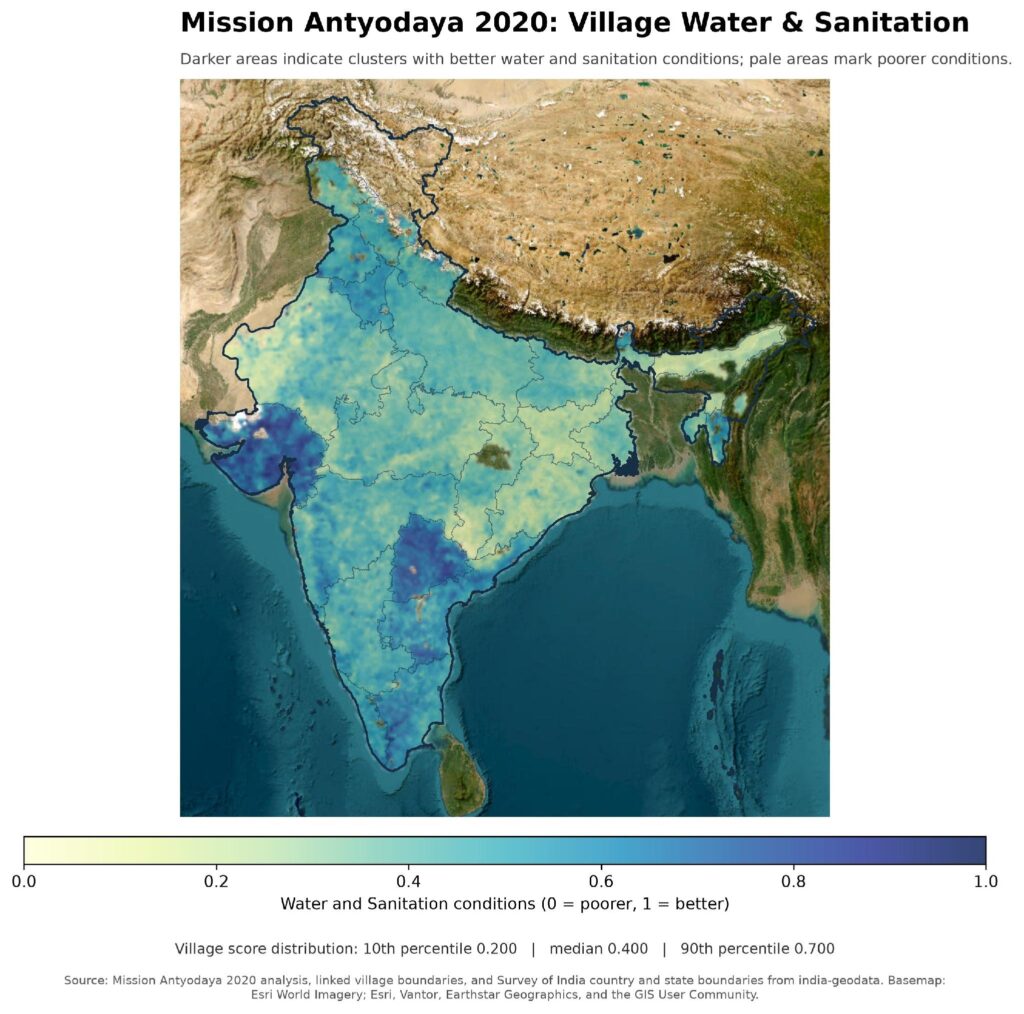
Figure 2: Village Water and Sanitation conditions across India.
Limitations
The classes are relative groupings in the 2020 data, not service standards, administrative rankings, causal findings, or programme recommendations. Missing values, uneven reporting, aggregation, ecology, and local economic history can affect interpretation. Results should be checked against feature definitions, more recent data, and field conditions. Raw survey fields can help trace a result, but cannot replace the normalised analytical values.
References and data: Mission Antyodaya 2020 Village Cluster Analysis Report; GEE Data Explorer Application.